| Issue |
A&A
Volume 568, August 2014
|
|
|---|---|---|
| Article Number | A45 | |
| Number of page(s) | 20 | |
| Section | Astrophysical processes | |
| DOI | https://doi.org/10.1051/0004-6361/201322341 | |
| Published online | 12 August 2014 | |
Spectral evolution in gamma-ray bursts: Predictions of the internal shock model and comparison to observations
1 AIM (UMR 7158 CEA/DSM-CNRS-Université Paris Diderot) Irfu/Service d’Astrophysique, Saclay, 91191 Gif-sur-Yvette Cedex, France
e-mail: This email address is being protected from spambots. You need JavaScript enabled to view it.
2 UPMC-CNRS, UMR7095, Institut d’Astrophysique de Paris, 75014 Paris, France
e-mail: This email address is being protected from spambots. You need JavaScript enabled to view it.
3 Department of Physics, University of Rijeka, 51000 Rijeka, Croatia
Received: 22 July 2013
Accepted: 5 April 2014
Abstract
Context. Several trends have been identified in the prompt gamma-ray burst (GRB) emission: e.g. hard-to-soft evolution, pulse width evolution with energy, time lags, and hardness-intensity and hardness-fluence correlations. Recently, Fermi has significantly extended the spectral coverage of GRB observations and improved the characterization of this spectral evolution.
Aims. We want to study how internal shocks can reproduce these observations. In this model the emission comes from the synchrotron radiation of shock accelerated electrons, and the spectral evolution is governed by the evolution of the physical conditions in the shocked regions.
Methods. We present a comprehensive set of simulations of a single pulse and investigate the impact of the model parameters, related to the shock microphysics and to the initial conditions in the ejecta.
Results. We find general qualitative agreement between the model and the various observations used for the comparison. All these properties or relations are governed by the evolution of the peak energy and photon indices of the spectrum. In addition, we identify the conditions for quantitative agreement. We find that the best agreement is obtained for (i) steep electron slopes (p ≳ 2.7); (ii) microphysics parameters varying with shock conditions so that more electrons are accelerated in stronger shocks; and (iii) steep variations in the initial Lorentz factor in the ejecta. When simulating short GRBs by contracting all timescales, all other parameters being unchanged, we show that the hardness-duration correlation is reproduced, as well as the evolution with duration of the pulse properties. Finally, we investigate the signature at high energy of these different scenarios and find distinct properties – delayed onset, longer emission, and flat spectrum in some cases – suggesting that internal shocks could have a significant contribution to the prompt LAT emission.
Conclusions. Spectral evolution is an important property of GRBs that is not easily reproduced in most models for the prompt emission. We find that the main observed features can be accounted for in a quantitative way within the internal shock model. However, the current uncertainties on shock acceleration in the mildly relativistic regime and relativistic ejection by compact sources prevent us from deciding if one or several of the proposed scenario are viable. By combining observations over the whole spectral range of Fermi, it may be possible in the future to identify specific signatures imprinted by this uncertain underlying physics.
Key words: gamma-ray burst: general / shock waves / radiation mechanisms: non-thermal / methods: numerical
© ESO, 2014
1. Introduction
Since the launch of the Swift (in 2004, Gehrels et al. 2004) and Fermi (in 2008) satellites, there has been a significantly growing sample of gamma-ray bursts (GRBs) with a known redshift and a well characterized gamma-ray prompt emission (see e.g. the recent review by Gehrels & Razzaque 2013). The high-energy domain (>100 MeV) is currently explored by Fermi-LAT (Atwood et al. 2009). The sample of detected bursts is still small but has allowed identification of several important spectral and temporal properties (Omodei et al. 2009; Zhang et al. 2011; Ackermann et al. 2013), which are summarized in Sect. 6. In the soft gamma-ray range, the GRB sample is much larger and not limited to the brightest bursts. Thanks to its wide spectral range (8 keV−40 MeV), Fermi-GBM (Meegan et al. 2009) has significantly improved the description of the GRB properties in the keV−MeV range. This effort follows the results already obtained by several past or current missions, especially Burst And Transient Source Experiment (BATSE) on board the Compton Gamma-Ray Observatory (Kaneko et al. 2006), Beppo-SAX (Guidorzi et al. 2011), and HETE-2 (Lamb et al. 2004; Sakamoto et al. 2005). Based on this large set of observations, our current knowledge of the spectral and temporal properties of the GRB prompt soft gamma-ray emission is summarized in Sect. 2.
The standard GRB model associates the prompt gamma-ray emission to internal dissipation within an ultra-relativistic outflow (Γ ≳ 100) ejected by a new-born compact source (see e.g. Piran 1999). The nature of the dissipation mechanism and of the associated radiative process remains to be identified. To account for the observed short timescale variability (~ms), the internal shock model (Rees & Meszaros 1994), where variations in the bulk Lorentz factor lead to the formation of shock waves within the ejecta, was proposed for the extraction of the jet kinetic energy. The dissipated energy is distributed between protons, electrons, and magnetic field, and the prompt GRB emission is due to the synchrotron radiation of shock accelerated electrons, with an additional component due to inverse Compton scatterings. Detailed calculations of the expected light curves and spectra are available (Kobayashi et al. 1997; Daigne & Mochkovitch 1998; Bošnjak et al. 2009; Asano & Mészáros 2011) and show good agreement with observations except for a notable exception, the low-energy photon index, which is usually observed to be larger than the standard fast-cooling synchrotron slope −3/2. Several solutions have been proposed, such as the role of inverse Compton scatterings in the Klein Nishina regime (Derishev et al. 2001; Bošnjak et al. 2009; Nakar et al. 2009; Wang et al. 2009; Daigne et al. 2011) or the magnetic field decay in the shocked region (Derishev 2007; Zhao et al. 2014).
Other mechanisms could also play a role. Thermal emission is expected at the photosphere when the ejecta becomes transparent for its own radiation. Depending on the efficiency of both the acceleration process and the non-thermal emission above the photosphere, this emission could be bright (Mészáros & Rees 2000; Daigne & Mochkovitch 2002; Hascoët et al. 2013). In principle, it produces a narrow quasi-Planckian component (Goodman 1986; Pe’er 2008; Beloborodov 2011); however, different possible sub-photospheric dissipation processes may affect the spectrum, especially due to the Comptonization, so that it appears as non-thermal (Thompson 1994; Rees & Mészáros 2005; Pe’er et al. 2006; Giannios & Spruit 2007; Beloborodov 2010; Vurm et al. 2011; Toma et al. 2011; Veres & Mészáros 2012; Veres et al. 2013). The peak energy is governed by a detailed balance between the emission/absorption and scattering processes (Vurm et al. 2013), and it can reproduce the observed values (Beloborodov 2013, see however Zhang et al. 2012). The lateral structure of the jet may also affect the photospheric spectrum (Lundman et al. 2013; Lazzati et al. 2013).
Magnetized ejecta offer a third possibility. A strong initial magnetization may play a major role in the acceleration of the jet to relativistic speed (see e.g. Begelman & Li 1994; Daigne & Drenkhahn 2002; Vlahakis & Königl 2003; Komissarov et al. 2009; Tchekhovskoy et al. 2010; Komissarov et al. 2010; Granot et al. 2011) and is already invoked for this reason in some scenarios where the emission is due to the photosphere and/or internal shocks. However, if the ejecta is still magnetized at large distances, magnetic reconnection can provide a new dissipation process (Spruit et al. 2001; Drenkhahn & Spruit 2002; Lyutikov & Blandford 2003; Giannios & Spruit 2005; Zhang & Yan 2011; McKinney & Uzdensky 2012). Compared to the previous possibilities, this model cannot provide detailed predictions for the GRB light curves and spectra yet (see the preliminary calculation of the temporal properties by Zhang & Zhang 2014).
The photospheric emission should be present in all scenarios, even if very weak. On the other hand, magnetic reconnection requires strong magnetization at a large distance, which may prevent internal shock formation and propagation (Giannios et al. 2008; Mimica & Aloy 2010; Narayan et al. 2011). Therefore, depending on the magnetization in the emission site, only one of the two mechanisms should be at work. Recent observations of two components in the soft gamma-ray spectrum of a few bright Fermi-GBM bursts, one quasi-Planckian and the other non-thermal (Ryde et al. 2010; Guiriec et al. 2011, 2013; Axelsson et al. 2012), indicate that both the photosphere and either internal shocks or reconnection may indeed be at work in GRBs (Hascoët et al. 2013).
Aside from interpreting the light curves and spectra, a successful theoretical model should also reproduce the observed spectral evolution with time, which is mainly governed by the evolution of the peak energy of the spectrum. It can be related either to the physics of the dissipative mechanism in the outflow or to the curvature of the emitting surface. In the first case, the spectral evolution is due to an intrinsic evolution of the physical conditions in the flow, whereas it is a geometrical effect (delay, Doppler shift) in the second case. The spectral evolution in a pulse associated to the curvature effect has been studied by several authors and does not agree with observations (Fenimore et al. 1996; Dermer 2004; Shen et al. 2005; Shenoy et al. 2013). Then, the spectral evolution has to be understood from the physics of the dissipative mechanism and may therefore represent an important test for distinguishing the different possible prompt emission models listed above.
Regarding the photospheric emission, the spectral evolution has been computed only for non-dissipative photospheres (Daigne & Mochkovitch 2002; Pe’er 2008). As mentioned above, this model cannot reproduce the observed spectrum. In the case of a dissipative photosphere, the peak energy of the spectrum is fixed by complex physics (Beloborodov 2013), which makes a prediction of the spectral evolution difficult. It is usually assumed that modulations in the properties at the base of the flow will lead to the observed evolution (see for instance Giannios & Spruit 2007 when the dissipation is associated to magnetic reconnection). However, dissipative photospheric models require that the dissipation occurs just below the photosphere for the spectrum to be affected. It is not obvious that a change in the central engine leading to a displacement of the photosphere will affect the dissipation process in the same way so that it remains well located. Therefore, it still needs to be demonstrated that these models can reproduce the observed spectral evolution. In the context of an emission produced above the photosphere, several authors have investigated the time development of the photon spectrum without specifying the dissipation mechanism and related the observed spectral evolution to the evolution of the electron/photon injection rate and the decaying magnetic field (e.g. Liang 1997; Stern & Poutanen 2004; Asano et al. 2009; Asano & Mészáros 2011). It is encouraging that a reasonable agreement with observations is found in some cases. To reach a final conclusion, it is however necessary to carry on such a study in the context of a physical model for the dissipation, which gives a prescription for the accelerated electrons and the magnetic field. It is still out of reach for reconnection models owing to the lack of any spectral calculation. It has been done for the internal shock model using a very simple spectral calculation that only includes synchrotron radiation (Daigne & Mochkovitch 1998, 2002). Since these early calculations, the observational description of the spectral evolution has improved a lot, as has modelling of the emission from internal shocks. Therefore, we examine here the quantitative prediction of this model for the spectral evolution in GRBs.
For the first time, the detailed dynamical evolution has been combined with calculation of the radiative processes, and the outcome is compared to the large set of observed properties summarized in Sect. 2 (e.g. hard-to-soft evolution, pulse width evolution with energy, time lags, hardness-intensity/fluence correlation). In Sect. 3, we present our approach, which is based on the model developed in Bošnjak et al. (2009). Following Daigne et al. (2011), we define three reference cases, which are representative of the different possible spectral shapes in the keV−MeV range, and present a detailed comparison of their temporal and spectral properties with observations. Then we investigate in Sects. 4 and 5 the effect on our results of different assumptions for the microphysics and dynamics of the relativistic ejecta. The specific signatures in the Fermi-LAT range are presented in Sect. 6. We discuss our results in Sect. 7 and conclude in Sect. 8.
2. GRB temporal and spectral properties: observations
There are several general trends in GRB spectra and light curves that have been identified in the prompt emission observations by various missions during the past three decades. Spectral variations have already been observed by the KONUS experiment providing time-resolved data between 40 and 700 keV (Golenetskii et al. 1983). BATSE provided the largest database of high temporal- and spectral-resolution prompt GRB data and allowed detailed studies of the correlations between spectral and temporal properties (e.g. Band et al. 1993; Ford et al. 1995; Norris et al. 1996; Kaneko et al. 2006). Since GRB peak energies are usually above the higher energy limit of the Swift-BAT(~150 keV), it is difficult to examine the analogous correlations for the sample of Swift GRBs. The large number of events with determined redshifts makes this sample, however, of strong interest for testing spectral and temporal properties in the source frame (Krimm et al. 2009; Ukwatta et al. 2010). Fermi-GBM data are providing new insight into the temporal and spectral behaviour of GRBs, extending the spectral coverage to high energies and to energies below the BATSE low-energy threshold (e.g. Lu et al. 2012; Bhat et al. 2012). We list here the commonly observed trends in the spectral and temporal properties to which we refer in the subsequent sections when comparing the internal shock model with observations. We distinguish between short and long GRBs when necessary. It should be noted that, generally, GBM data indicate that the temporal and spectral evolution of short GRBs are very similar to long ones, but with light curves contracted in time and with harder spectra due to higher peak energies (Guiriec et al. 2010; Bhat et al. 2012).
Obs. #1 – Pulse asymmetry. When the burst has apparent separated pulses in the time histories, a fast rise and an exponential decay of the pulse is often observed (Fishman & Meegan 1995). Nemiroff et al. (1994) showed that the individual long pulses in GRBs are time-asymmetric. The most thorough study of pulses in long GRB light curves was provided by Norris et al. (1996) (see also e.g. Quilligan et al. 2002; Hakkila & Preece 2011) using 64 ms resolution BATSE data. They found a typical rise-to-decay time ratio ~0.3−0.5 for long pulses independently of the energy band and also showed that short pulses tend to be more symmetric. This trend is confirmed by the analysis of pulses in short GRB light curves by McBreen et al. (2001).
Obs. #2 – Energy-dependent pulse asymmetry. Norris et al. (1996) found that the dominant trend in the pulse shapes observed in different energy channels is a faster onset at higher energies and a longer decay at lower energies. The dependence between the energy Eobs and the pulse width is approximately a power law,  with a ≃ 0.40, in a sample of long BATSE bursts (Fenimore et al. 1995; Norris et al. 1996). The same evolution with a ≃ 0.40 is also found in samples of long pulses with long time lags (Norris et al. 2005). Bissaldi et al. (2011) find the same trend for Fermi bursts with a ≃ 0.40 (see also Bhat et al. 2012).
Obs. #3 – Time lags. Time lags are commonly observed in GRB pulses: pulses tend to peak earlier at higher energy in the soft gamma-ray range (Norris et al. 1996). Time lags were studied for a large sample of BATSE GRBs (Band 1997; Norris 2002; Hakkila et al. 2008). Short lags (<350 ms) dominate the BATSE sample, even if a long lag (>1 s) subpopulation was identified by Norris (2002). Norris et al. (2001) and Norris & Bonnell (2006) found negligible lags for a sample of BATSE, Swift, and HETE-2 short GRBs (see also Yi et al. 2006). Guiriec et al. (2010) confirm negligible spectral lags below 1 MeV for three bright short GRBs observed by Fermi.
Obs. #4 – Hard-to-soft evolution. Norris et al. (1986) examined a handful of bursts observed by the Solar Maximum Mission satellite between 50 and 300 keV and found that the pulse emission evolved from hard to soft with the hardness maximum preceeding the peak of the intensity. More detailed studies followed using BATSE data (Bhat et al. 1994; Ford et al. 1995; Band 1997): it was found that the spectral peak energy Ep,obs is rising or slightly preceding the pulse intensity increase and is softening during the pulse decay (hard-to-soft evolution within a pulse). The later pulses in burst time history were also found to be softer than earlier ones (global hard-to-soft evolution). For Fermi-GBM bursts, Lu et al. (2012) report the same hard-to-soft evolution in the variation with time of the spectral peak energy in the majority of GRBs, but also find cases where the peaking energy is simply tracking the intensity. These bursts usually show more symmetric pulses. Short Fermi GRBs are usually found to follow the “intensity tracking” pattern.
Obs. #5 – Hardness-intensity correlation (HIC). Golenetskii et al. (1983) reported the discovery of a correlation between the instantaneous luminosity and the temperature kT characterizing the photon spectrum, L ∝ (kT)γ, with γ ≈ 1.5−1.7. Kargatis et al. (1994) investigated bursts from the SIGNE experiment (50−700 keV) and confirmed the luminosity-temperature correlation in ~50% of the events with a wider spread for the exponent, γ ≈ 1.3−2.7. Kargatis et al. (1995) performed the spectral analysis of the decay phase in BATSE GRB pulses and found that the spectral peak energy correlates with the instantaneous energy flux F(t) as  (hardness intensity correlation, or HIC). Borgonovo & Ryde (2001) studied this HIC using the value of EFE at the peak energy to represent the intensity and find it is proportional to
  . This makes the correlation less dependent on the observational spectral window. The mean value of η was found to be 2.0, and it corresponds to a mean value of γ = 1.9. Ryde & Svensson (2000, 2002) studied the HIC in a large sample of BATSE bursts using the instantaneous photon flux N(t) and find Ep,obs ∝ N(t)δ, with δ ~ 0.4−1.1. More recently, a similar HIC was found in GBM bursts using the energy flux F(t), Ep,obs ∝ F(t)κ, with κ ≃ 0.4−1.2 (Lu et al. 2012; Guiriec et al. 2013). We focus on these two most recent studies of the HIC to compare with model predictions in the next sections.
Obs. #6 – Hardness-fluence correlation (HFC). This correlation was discovered by Liang & Kargatis (1996). It describes the exponential decay of the spectral hardness as a function of the cumulative photon fluence Φ(t), Ep,obs(t) ∝ exp(− Φ(t)/Φ0). Crider et al. (1999) tested a reformulated correlation using energy fluence instead of the photon fluence and confirm the decay pattern. Ryde & Svensson (2000) used this correlation combined with the HIC correlation to obtain a self-consistent description for the temporal behaviour of the instantaneous photon flux and got good agreement with BATSE data.
Obs. #7 – Hardness-duration correlation. Kouveliotou et al. (1993) reported that short GRBs are harder than long ones. Hardness was characterized by the ratio of the total counts in the two BATSE energy channels (usually 100−300 keV and 50−100 keV energy range). Ghirlanda et al. (2004) argue that the hardness of the short events is owing to a harder low-energy spectral slope (photon index α) in short bursts, rather than to a higher peak energy Ep,obs. This is not confirmed by the detailed analysis of three bright GBM short GRBs by Guiriec et al. (2010), which shows that the hardness of short bursts is due both to hard low-energy photon indexes α and to high peak energies Ep,obs.
3. Spectral evolution in the internal shock model
3.1. Modelling the emission from internal shocks
Several steps are needed to model the prompt GRB emission from internal shocks. From the initial conditions in the ultra-relativistic outflow ejected by the central engine, the dynamical evolution must be calculated. This allows us to know how many internal shocks will form and propagate within the outflow and to compute the time evolution of the physical conditions in each of the shocked regions (Lorentz factor, mass and energy density, etc.). Then, the distribution of shock-accelerated electrons and the intensity of the shock-amplified magnetic field must be evaluated. This is the most uncertain step and is usually done using a very simple parametrization of the local microphysics. By knowing the distribution of relativistic electrons accelerated at each shock and the magnetic field, it is then possible to compute the emission produced in the comoving frame of each shocked region, when taking the relevant radiative processes into account. Finally, the contributions of each emitting region are summed up, taking several effects into account: relativistic effects (Doppler boosting, relativistic beaming), the curvature of the emitting surface (integration on equal-arriving time surfaces), and cosmological effects (redshift, time dilation). This full procedure allows light curves and time-evolving spectra to be predicted for synthetic GRBs and therefore a detailed comparison to be made with observations.
To follow this procedure, we use the model described in Bošnjak et al. (2009). We assume that the outflow at a large distance from the source has negligible magnetization, which can be achieved either in the standard fireball or in an efficient magnetic acceleration scenario, which is supported by observations (Hascoët et al. 2013). A moderate magnetization (σ ≳ 0.01−0.1) may affect the spectrum of internal shocks, especially at high energy (Mimica & Aloy 2012). The model parameters are of two types: (i) the initial conditions for the dynamics of the relativistic outflow, given by the duration of the relativistic ejection tw, the initial distribution of the Lorentz factor Γ(tej), where 0 ≤ tej ≤ tw is the time of the ejection, and the initial kinetic power Ė(tj); (ii) the microphysics parameters. It is assumed that a fraction ϵB of the dissipated energy in a shocked region is injected into the amplified magnetic field and that a fraction ϵe of the energy is injected into a fraction ζ of the electrons to produce a non-thermal population. The distribution of these accelerated relativistic electrons is a power law with a slope −p.
We refer to Bošnjak et al. (2009) for a detailed description of the model, which is based on a multi-shell approximation for the dynamics and a radiative code that simultaneously solves the time evolution of the electron and photon distributions in the comoving frame of the emitting material, taking all the relevant processes into account: synchrotron radiation and self-absorption, inverse Compton scattering (including Klein-Nishina regime), γγ annihilation, and adiabatic cooling.
Depending on the choice of microphysics parameters, the typical Lorentz factor of the shock-accelerated electrons and the intensity of the magnetic field can be rather different, even for similar relativistic outflows and dynamical evolutions. Then, the dominant radiative process in the soft gamma-ray range (BATSE or GBM) could be either direct synchrotron radiation or inverse-Compton scattering of a low-energy synchrotron photon (SSC). Bošnjak et al. (2009) have shown that the second case would predict a bright additional component in the GeV, owing to the second inverse-Compton scatterings. Such a peak does not seem to be observed by Fermi, and the SSC scenario is probably ruled out, as discussed for instance by Piran et al. (2009). Therefore we focus here on the scenario where the prompt GRB emission is dominated by synchrotron radiation from shock-accelerated electrons in internal shocks. In this case, there are in principle two components in the spectrum, one that peaks in the soft gamma-ray range owing to synchrotron radiation, and a second one that peaks at high energy, associated to inverse Compton scatterings, which are very likely in the Klein-Nishina regime.
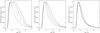 |
Fig. 1 Three reference cases: normalized light curves in the four BATSE channels (blue line: 20−50 keV; black line: 50−100 keV; green line: 100−300 keV; red line: 300−2000 keV) for the cases A, B, and C (see text). |
3.2. Three reference cases
Even in the synchrotron scenario, the spectral shape of the prompt emission still depends strongly on the assumptions for the microphysics parameters. Assuming that electrons are radiatively efficient (synchrotron fast cooling, Sari et al. 1998), which is required both by the variability timescale and the energetics of the prompt emission, there are three main possibilities, which have been described by Daigne et al. (2011) and illustrated with three reference cases. Each of these cases corresponds to an example of a single pulse burst that should be seen as a building block for more complex light curves. The initial Lorentz factor rises during the ejection, according to the simple law 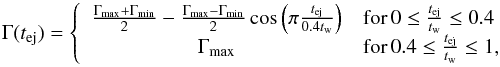 (1)with Γmin = 100 (resp. 300) and Γmax = 400 (resp. 1200) in cases A and B (resp. case C) (see Fig. 1 in Bošnjak et al. 2009). The duration of the ejection is tw = 2 s, and the injected kinetic power is constant and equals Ė = 1054 erg s-1 (resp. 5 × 1052 erg s-1) in cases A and B (resp. in case C). Then, the collision of the “slow” and “rapid” parts in the ejecta lead to the formation of two internal shock waves, a short lived “forward” shock and a “reverse” shock that crosses most of the ejecta and dominates the emission. The three reference cases differ mainly by the microphysics: in all three cases, ϵe = 1/3 and p = 2.5, but the two other microphysics parameters ϵB and ζ are different.
Case A. Pure fast-cooling synchrotron case, with ϵB = ϵe = 1/3 and ζ = 0.003. For ϵB ≳ ϵe, inverse Compton scatterings are very inefficient. Then the radiated spectrum does not show an additional component at high energy and is very close to the standard fast-cooling synchrotron spectrum with a low-energy photon index α = −3/2.
Case B. Fast-cooling synchrotron case affected by inverse-Compton scattering in Klein Nishina regime with ϵB = 10-3 and ζ = 0.001. For ϵB ≪ ϵe, inverse-Compton scattering becomes efficient and leads to a second spectral component at high energy, which remains however weak because of the Klein-Nishina regime. In addition, because the scatterings are more efficient for low-energy photons in this regime, the low-energy photon index of the synchrotron component is modified and becomes larger than the standard fast-cooling value: −3/2 ≲ α ≲ −1 (see also a discussion of this case for GRB 080916C in Wang et al. 2009).
Case C. Marginally fast-cooling case with ϵB = 0.1 and ζ = 0.001. In some conditions, it is possible that the cooling frequency νc becomes very close to the synchrotron frequency νm. In such a situation, where νc ≲ νm, radiation is still efficient (fast cooling), but the intermediate region of the spectrum where α = − 3/2 disappears. Large photon indices – possibly as large as α = − 2/3, usually expected in the slow cooling regime – can then be measured. It would require some fine tuning for this marginally fast-cooling regime to be reached in most GRBs, but the necessary conditions may be encountered in some parts of a burst prompt phase, especially when the flux is weaker and the emission softer. Recently, Beniamini & Piran (2013) have found that the conditions for the marginally fast cooling may indeed be found in a noticeable region of the parameter space.
The corresponding GBM and LAT light curves for these three cases are plotted in Figs. 8–10 in Daigne et al. (2011), together with the predicted time evolution of the peak energy Ep,obs and the low-energy photon index α of the synchrotron component (GBM range), assuming a source redshift z = 1. We have plotted for each case the normalized light curves in the four BATSE channels in Fig. 1 and the spectral evolution in Fig. 2. In the three cases, spectral evolution is found, with a general trend for the peak-energy to follow the intensity and with a hard-to-soft evolution during the pulse decay.
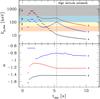 |
Fig. 2 Three reference cases: spectral evolution. The time evolution of the observed peak energy Ep,obs (top) and low-energy photon index α (bottom) is plotted for the three reference cases: A (black), B (red), and C (blue). In the top panel, the energy range of the four BATSE channels is also indicated. |
3.3. Origin of the temporal and spectral evolution
Three possible timescales can affect the observed evolution: the radiative timescale for the cooling of shock accelerated electrons, the hydrodynamical timescale associated to the propagation of internal shocks, and the timescale associated to the curvature effect or high-latitude emission. The radiative timescale has to be the shortest to allow for the observed short timescale variability (Rees & Meszaros 1994; Sari et al. 1996; Kobayashi et al. 1997) and cannot be the main driver of the observed spectral evolution. The curvature effect leads to a strong temporal and spectral evolution that is not observed during most of the prompt emission (Fenimore et al. 1996; Dermer 2004; Shenoy et al. 2013), but is most probably responsible for the early steep decay found in the X-ray afterglow by Swift-XRT (see Hascoët et al. 2012, for a recent discussion in the context of different GRB prompt emission models), as demonstrated in several studies (see e.g. Kumar & Panaitescu 2000; Liang et al. 2006; Butler & Kocevski 2007; Zhang et al. 2007; Qin 2008; Genet & Granot 2009; Willingale et al. 2010). Therefore, the temporal and spectral evolution of GRB pulses in the internal shock model has to be governed mainly by the hydrodynamical timescale (Daigne & Mochkovitch 2003).
When an internal shock is propagating within the outflow, the corresponding bolometric luminosity is given by 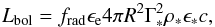 (2)where R is the shock radius, Γ∗ the Lorentz factor of the shocked material, ρ∗ and ϵ∗ are the mass and the specific internal energy density in the shocked region (comoving frame), and frad the radiative efficiency, which is close to 1 for synchrotron radiation in a fast-cooling regime. For typical values representative of cases A, B, and C close to their maximum, we have
 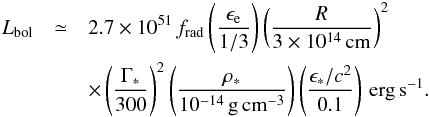 (3)Figure 12 shows the time evolution of Γ∗, ρ∗, and ϵ∗ in cases A and B. Case C shows similar behaviour. In these three examples, the bolometric luminosity is initially rising when the shock forms (increase in Γ∗ and ϵ∗), reaches a maximum, and then decreases again due to the radial expansion (decrease in ϵ∗ and ρ∗); see Bošnjak et al. (2009) for a more detailed discussion. This leads to the pulse shape of the light curve. In more realistic cases, a large number of shock waves will form and propagate in the flow, and several of them can contribute at the same time, leading to a complex, multi-pulse light curve.
Parameters of all the GRB pulse models discussed in the paper.
In addition to the evolution of the bolometric luminosity, the spectral evolution affect the details of the pulse shape in a given energy band. When the synchrotron peak is not too affected by inverse-Compton scattering in Klein-Nishina regime (see below), the observed peak energy can be expressed as  , where
  is the peak of the synchrotron spectrum in the comoving frame, leading to
 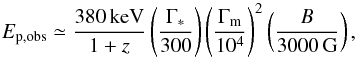 (4)where B is the intensity of the magnetic field (comoving frame), and Γm the minimum Lorentz factor of the power-law distribution of accelerated electrons. These last two quantities can be estimated from the microphysics parameters, leading to
 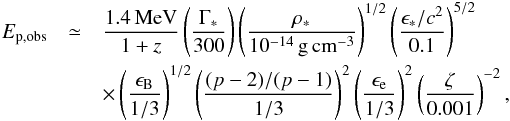 (5)using typical values for Γ∗, ρ∗, and ϵ∗ at the time corresponding to the maximum of the light curve in cases A or B. The spectrum around Ep,obs is very close to the standard fast cooling synchrotron spectrum (i.e. α = − 3/2) in case A and shows a larger low-energy photon index in case B (α ≃ − 1.1) owing to inverse Compton scattering in the Klein Nishina regime. As shown in Daigne et al. (2011), this effect is expected for high values of both the Compton parameter given by
 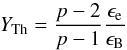 (6)and the parameter wm defined by
  (7)The Compton parameter YTh defined in Eq. (6) is computed assuming the Thomson regime for the scatterings. The effective Compton parameter in the simulations presented here is always smaller due to the Klein-Nishina corrections. Close to the maximum of the pulse light curve, YTh ≃ 110 (resp. 0.33) and wm ≃ 60 (resp. 40) for case B (resp. case A).
From Eqs. (5)−(7), the evolution of the physical conditions (Γ∗, ρ∗, and ϵ∗) in the shocked region during the propagation of the shock wave leads to an evolution of the peak energy and the spectral shape (particularly the photon index α) and is therefore at the origin of the observed spectral evolution. The combination of the evolution of bolometric power Lbol and this spectral evolution allows us to understand the details of the pulse shape in a given energy channel. The luminosity at a given photon energy can be written as  (8)where
  is the spectral shape, normalized by
  . Then the flux in the energy channel [E1,obs;E2,obs] is given by
  (9)The light curve is shaped by the two terms in Eq. (9). The evolution of the first term has been described above and is responsible for the general shape of the light curve with a clear peak. The spectral correction contained in the second term is more complicated because it depends on the energy channel and is responsible for the time lags, evolution of the pulse shape with energy, etc. (Daigne & Mochkovitch 1998, 2003; Hafizi & Mochkovitch 2007; Boçi et al. 2010).
The temporal and spectral evolution that has just been described is valid as long as the internal shock phase is active and the observed emission is dominated by the contribution of on-axis radiation from shocked regions. After the last internal shock has disappeared, the observed emission is due to the high latitude emission and is therefore governed by the geometry of the shells and the relativistic Doppler effects, which lead to the asymptotic evolution Ep ∝ 1 /tobs. The corresponding bolometric flux decreases as  leading to a spectral evolution that is much too fast to reproduce the properties of observed bursts, as pointed out by Fenimore et al. (1996); for instance, the HIC would have a slope δ< 0.5 instead of the typical observed value δ ≃ 0.5 − 1. This clearly indicates that the spectral evolution in GRB pulses is governed not by such geometrical effects but by the physics of the internal dissipative and radiative process in the outflow as described above.
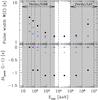 |
Fig. 3 Three reference cases: dependence of the pulse shape on energy. Top: pulse width as a function of energy. Bottom: position of the pulse maximum in channel i with respect to the lowest considered energy band, 20−50 keV (BATSE channel 1). Dashed lines show the energy bands for which the light curves were calculated. The first 4 energy bands correspond to the same 4 BATSE channels as used in Fig. 1. The shaded regions indicate the spectral coverage of Fermi GBM and LAT detectors. Black dots correspond to reference case A, red crosses to case B, and blue square symbols to case C. |
3.4. Comparison to observations
We now compare the spectral evolution found in reference cases A, B, and C to the available observations more quantitatively. Fig. 1 shows the normalized light curve in the four BATSE channels for each case, and Fig. 2 shows the corresponding spectral evolution. The break at tHLE,obs ≃ 5.4 s corresponds to the end of the on-axis emission and the transition to the high-latitude emission that decays faster. In a complex light curve, the probablity of observing this transition is low since it is very likely hidden by the overlapping on-axis emission of another pulse (see however Sonbas 2012). It is only at the end of the prompt phase that the high-latitude emission can be observed (early steep decay in X-rays). We focus here on the pulse temporal and spectral properties during the on-axis emission, i.e. for tobs<tHLE,obs.
There is good qualitative agreement with observations (see Sect. 2). In particular, it is found that the pulse light curve is asymmetric with a fast rise and a slow decay (Obs. #1); this asymmetry is stronger at lower energy (Obs. #2), and the width of the light curve is broader at lower energy (Obs. #2); the pulse light curve peaks earlier at higher energy (Obs. #3); the peak energy decreases in the decay phase of the pulse (Obs. #4).
The more quantitative comparison is less satisfactory:
-
The shape of the pulse in Channels 1 and 2 for case A shows a double peak that does usually not seem to be observed in GRBs. This stems from too strong a spectral evolution in this case (see Fig. 2). The peak energy has a maximum Ep,obs ≃ 800 keV close to the first maximum of the light curve at tobs ≃ 1.5 s and then decreases rapidly, reaching Ep,obs ≃ 10 keV at the end of the on-axis emission at tHLE,obs. The rapid decrease of Ep,obs leads to an increase in the second term in Eq. (9) (spectral correction) for Channels 2 and 1, which are successively crossed by Ep,obs. This compensates the decrease in the bolometric luminosity to create a second peak in the light curve for these two channels.
-
In the three cases, the pulse width does not decrease enough with energy. This is illustrated in Fig. 3 (upper panel), where W(E) is plotted as a function of the mean energy of the channel, defined by
 where Emin and Emax are the lower and higher energy bounds. In agreement with observations, it is found that the width approximatively follows a power-law evolution W(E) ∝ E− a. However, the value of the index a, listed in Table 1, is usually a little too small compared to observations (Obs. #2). The best agreement is found for case A.
 -
Time lags between the different channels are too large, as illustrated in Fig. 3 (lower panel). A quantitative comparison with observations is more delicate since we do not measure the lag by the maximum of correlation as in the method described by e.g. Band (1997), which is usually applied to GRB data. We instead plot the difference between the time of the maximum of the light curve in a given channel, and the time of the maximum in Channel 1. The observed trend is reproduced (Channel 4 peaks first, Channel 1 peaks the last), but, especially in Case A, the typical lags are too long compared to observations (Obs. #3).
-
The HIC is qualitatively reproduced, as illustrated in Fig. 4 (left panel), where the peak energy Ep,obs is plotted as a function of the photon flux N in the 20–2000 keV range on log–log scale. The peak energy increases during the rise of the light curve, reaching a maximum that precedes the maximum of the intensity. Then it decreases during the pulse decay (hard-to-soft evolution, Obs. #4). However, the quantitative behaviour is not reproduced. During the pulse decay, the peak energy should follow Ep,obs ∝ Nδ with δ ≃ 0.5 − 1 or Ep,obs ∝ Fκ with κ ≃ 0.4 − 1.2, N and F being the photon and energy fluxes (Obs. #5). This is not found in our simulations. Cases B and C do not show a simple power-law behaviour during the decay phase. Case A is closer to the expected evolution, but the slopes δ and κ are too steep compared with BATSE and GBM observations.
-
The same disagreement is found for the HFC, as illustrated in Fig. 4 (right panel). Again, Cases B and C do not really show the expected behaviour, log Ep,obs ∝ Φ, whereas the agreement is better for Case A, with a quasi exponential decay for the peak energy as a function of the photon fluence (Obs. #6).
We conclude that the three reference cases A, B, and C, which are representative of the scenario where the prompt GRB emission is dominated by the synchrotron radiation from shock-accelerated electrons in internal shocks, can reproduce the qualitative spectral evolution identified in GRBs observed by BATSE and GBM and described in Sect. 2 well, but that there is no quantitative agreement, because the spectral evolution is usually too strong in the three simulated bursts compared to observations. This apparent disagreement may help us shed light on some uncertainties in the considered scenario. From Eq. (3) and Eqs. (5)−(7), there are two groups of factors that can affect our results: the assumptions for the microphysics in the shocked region and the assumptions for the initial conditions in the outflow that impact the dynamics of the internal shock phase. We now investigate in Sects. 4 and 5 how these factors affect the predicted spectral evolution and whether the observed evolution can be reproduced better.
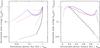 |
Fig. 4 Three reference case: hardness-intensity and hardness-fluence correlations. The peak energy energy is plotted as a function of the photon flux (left panel) and photon fluence (right panel) between 20 keV and 2 MeV for the three reference cases, A (black), B (red), and C (blue). The peak energy, photon flux, and photon fluence are normalized by their respective maximum values. The dashed lines show the behaviour during the rise of the pulse, thick lines correspond to the decay phase, and the thin lines are the high-latitude emission. This last stage is unlikely to be observed in complex light curves, except during the early steep decay in X-rays. |
4. Impact of the uncertainties on the microphysics
Because of a lack of better, physically motivated prescriptions, the microphysics in the shocked region (magnetic field amplification, electron acceleration) is simply parametrized by ϵB, ϵe, ζ, and p in our model of the internal shock phase. Such an overly simplistic description may be at the origin of some disagreements between the simulated and observed spectral evolution pointed out in the previous section. We investigate here this possibility and focus on the two most relevant cases, A and B.
4.1. Steeper electron slopes?
Unfortunately, the current physical understanding of shock acceleration in the mildly relativistic regime does not allow predicting the value of the slope p of the electron distribution. A “standard” value p = 2.5 is adopted in the three reference cases of Daigne et al. (2011). We investigate here how changing p affects the predicted temporal and spectral properties of the simulated pulse. The most dramatic change is for Case B. For low values of p, Case B shows a very peculiar spectral evolution in the decay phase of the pulse, the peak energy starting to increase after an initial decrease. The more standard simple hard-to-soft evolution is recovered above a threshold p ≃ 2.7, as shown in Fig. 5 where the time evolution of Ep,obs and α is plotted for Case B for different values of p. Moreover, we find that increasing p improves the quantitative comparison between the predicted and observed spectral evolution in Cases A and B: see for instance the values of the index a and the slopes δ and κ in Table 1 and the corresponding Fig. 7 (pulse width, time lags) and Fig. 6 (HIC).
The peculiar evolution of the peak energy for p ≲ 2.7 can be understood from the theoretical spectra computed by Daigne et al. (2011) in this spectral regime where the synchrotron spectrum is affected by inverse Compton scattering in the Klein Nishina regime (see Fig. 2 in Daigne et al. 2011). For high values of the Compton parameter YTh, which favours the scatterings, not only is the low-energy slope of the synchrotron spectrum affected, but also the peak, which moves towards higher energy, with the spectrum around the peak becoming very flat. The synchrotron peak energy in the comoving frame is no longer simply proportional to  , and the standard spectral evolution governed by Eq. (5) is lost. For higher p, we find numerically that the peak is not shifted any more, even for very high values of YTh. This is also confirmed by the semi-analytical calculation of the Klein-Nishina effects on optically thin synchrotron and synchrotron self-Compton spectrum made by Nakar et al. (2009): see the discussion of their case IIc, which is relevant for our reference case B1. They find a threshold at p = 3, slightly more than p ≃ 2.7. This difference is probably due to the additional approximations that are necessary to allow for the analytical treatment, compared to the full numerical resolution we use here.
4.2. Varying microphysics parameters?
A strong but common assumption is to assume constant microphysics parameters in a GRB. That different values of the parameters are needed to fit observations from different GRBs (see for instance the case of GRB afterglows as in the study by Panaitescu & Kumar 2001) indicates, on the other hand, that there are no universal values. Then, it is highly probable that ϵB, ϵe, ζ, and p depend on the shock conditions and evolve during a GRB. In Daigne & Mochkovitch (2003), where only synchrotron radiation was included in a simple way, it was shown that assuming such variations in the microphysics parameters could greatly improve the comparison between the predicted and the observed spectral evolution in a pulse. As there are no physically motivated prescriptions for such variations, we cannot fully explore this possibility. We only illustrate the effect in Cases A and B, assuming a simple variation law for one parameter, i.e. ζ ∝ ϵ∗ as suggested by Bykov & Meszaros (1996), so that a larger fraction of electrons is accelerated when the shock is more violent. We have normalized ζ to have a similar peak energy of the time-integrated spectrum as in the reference cases (see Table 1). From Eq. (5), it clearly appears that this prescription will reduce the variations in Ep,obs during the pulse, since it is now only proportional to  rather than
  . This is confirmed by our detailed radiative calculation, as illustrated for Case B in Fig. 8 (spectrum) and in Fig. 11 (left panel: spectral evolution). The peak energy decreases only by a factor ~4 during the pulse decay and α remains close to −1.1 for most of the evolution.
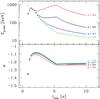 |
Fig. 5 Impact of the electron slope p: spectral evolution. The time evolution of the observed peak energy Ep,obs (top) and low-energy photon index α (bottom) in case B is plotted for different values of the relativistic electron slope p. The evolution for p = 3.3 and p = 3.9 has also been computed but is not shown because the curves coincide with the case p = 2.9. In each case, the value of ζ is adjusted to keep the same observed peak energy of the time-integrated spectrum (see Table 1). |
In agreement with the results of Daigne & Mochkovitch (1998, 2003), the pulse shape is dramatically improved in both cases (Fig. 10), and especially in Case A where the double peak in the reference case has disappeared (left panel). In Case B, there is in addition a general improvement of most relations, as illustrated in Fig. 11, bottom right-hand panel (time lags) and top right-hand panel (pulse width), Fig. 9 (HIC), and from Table 1. In summary, this modified Case B with a varying electron fraction ζ has an overall good agreement with BATSE and GBM observations. Especially, the predicted spectral evolution reproduces now qualitatively and quantitatively the observational constraints Obs. #1 to Obs. #6 described in Sect. 2.
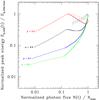 |
Fig. 6 Impact of the electron slope p: hardness-intensity correlation. The HIC diagram in Case B is plotted for different values of the relativistic electron slope p. |
The assumption ζ ∝ ϵ∗ is suggested by Bykov & Meszaros (1996), but one may expect variations in other microphysics parameters as well. We expect that any modification of the microphysics leading to a reduced dependence of the peak energy to the shock conditions will produce a similar improvement to the one described here.
We conclude that the disagreement between the observed spectral evolution in GRBs and the predictions of the simplest version of the internal shock model illustrated by our reference cases A, B, and C can be largely due to over-simplifying assumptions regarding the microphysics in the emitting shocked regions. Our current knowledge of the physics of mildly relativistic shocks does not yet allow this description to be improved, but we have illustrated that both a qualitative and quantitative agreement can be achieved, for instance, if the fraction of accelerated electron varies with the shock strength.
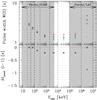 |
Fig. 7 Impact of the electron slope p: pulse width and time lags. Same as in Fig. 3 for Case B with four different values of the electron slope p. Colour code is the same as in Fig. 5. In the lower panel, the time lags are the same for the four cases except for the highest energy channel where the p = 2.3 and p = 2.5 cases show an important lag, whereas the p = 2.7 and p = 2.9 cases do not show any lag. |
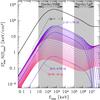 |
Fig. 8 Impact of a varying accelerated electron fraction ζ: spectral evolution. Time-resolved spectra are plotted for Case B assuming a varying parameter ζ during the propagation of internal shocks (see text). The corresponding light curves are shown in the right panel of Fig. 10. Each curve corresponds to a time interval of 0.25 s, starting with the bluest curve (0.5–0.75 s) and finishing with the reddest one (9.75–10 s). The time bin corresponding to the pulse maximum is indicated (1.5–1.75 s). The time-integrated spectrum is also plotted as a thick black line. A thin dashed line of photon index α = − 1 is indicated for comparison. |
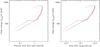 |
Fig. 9 Impact of a varying accelerated electron fraction ζ: hardness-intensity correlation. Same as in Fig. 4 for Case B with a varying parameter ζ during the propagation of internal shocks (see text), either with the same ejection duration as in the reference Case B (black) or with an extended high-Lorentz factor tail in the ejecta (red): see Sect. 5.1. |
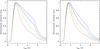 |
Fig. 10 Impact of a varying accelerated electron fraction ζ: pulse shape. Same as in Fig. 1 for Cases A (left panel) and B (right panel) assuming a varying parameter ζ during the propagation of internal shocks (see text). Conventions are the same as in Fig. 1. The corresponding time-evolving spectrum for Case B is shown in Fig. 8. |
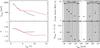 |
Fig. 11 Impact of a varying accelerated electron fraction ζ: spectral evolution – pulse width and time lags. Curves are plotted for Case B with a varying parameter ζ during internal shocks (see text), either with the same ejection duration as in the reference Case B (black) or with an extended high-Lorentz factor tail in the ejecta (red): see Sect. 5.1. For the first case (black, 2 s duration for the ejection), the corresponding spectra and light curves are plotted in Fig. 8 and in the right panel of Fig. 10. Left panel: the time evolution of the peak energy and the low-energy photon index. The dashed vertical line indicates the start of the high-latitude emission. Right panel: evolution of the pulse width and time lags, as in Fig. 3. |
5. Impact of the uncertainties on the dynamics
The physics of the central engine and of the acceleration of the relativistic outflow are not well understood. This does not allow predicting the initial conditions in the jet before the internal shock phase. Typically, a pulse is due to the collision between two regions with different Lorentz factors (in the reference cases, the “slow” region corresponds to Γ(tej) = Γmin → Γmax, and the “rapid” region to Γ = Γmax, see Eq. (1)). Two internal shocks form, a “forward” and a “reverse” shock (see Fig. 12). In the reference cases, the emission is entirely dominated by the “reverse” internal shock. This assumption has the advantage of simplicity to simulate a single pulse burst (as a building block for more complex light curves), but it is not physically motivated. We now investigate how these assumptions can affect the dynamics of the internal shock phase and therefore the spectral evolution in pulses.
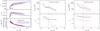 |
Fig. 12 Evolution of the physical conditions in the shocked region. Left panel: the evolution of the Lorentz factor Γ∗ (top), the specific energy density ϵ∗ (middle), and the mass density ρ∗ (bottom) is plotted for the reference Case B (Case A would show exactly the same evolution), Case B with a sharp distribution of the initial Lorentz factor (see text) and Case B with a constant ejected mass flux Ṁ rather than a constant injected kinetic power Ė (see text). For each case, two curves are seen, corresponding to the propagation of “forward” and “reverse” internal shocks. Middle panel: corresponding spectral evolution (same colour code) assuming a constant fraction ζ of accelerated electrons. Right panel: corresponding spectral evolution (same colour code) assuming a varying fraction ζ of accelerated electrons (see text). |
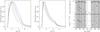 |
Fig. 13 Impact of the initial distribution of the Lorentz factor in the outflow. Left and middle panels: normalized light curves corresponding to the 4 BATSE energy channels for Case B computed with the sharp initial distribution of the Lorentz factor given by Eq. (10) and a constant (left) or varying (middle) accelerated electron fraction (see text). Conventions are the same as in Fig. 1. Right panel: pulse width and pulse maximum position as a function of energy for the same cases (filled circles: constant ζ, open circles: varying ζ). The shaded regions and lines have the same meaning as in Fig. 3. |
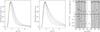 |
Fig. 14 Impact of the shape of the injected kinetic power in the outflow. Left and middle panels: normalized light curves corresponding to the 4 BATSE energy channels for Case B computed by assuming a constant ejected mass flux Ṁ rather than a constant injected kinetic power Ė (see text) and a constant (left) or varying (middle) accelerated electron fraction (see text). Conventions are the same as in Fig. 1. Right panel: pulse width and pulse maximum position as a function of energy for the same cases (filled circles: constant ζ; open circles: varying ζ). The shaded regions and lines have the same meaning as in Fig. 3. |
5.1. Effect of the initial Lorentz factor
In the reference cases, the Lorentz factor during the relativistic ejection increases continuously from Γmin to Γmax. The shape of the transition can affect the radius where the internal shocks form and the initial strength of the shocks. It will therefore affect the pulse shape and the spectral evolution, especially in the early phase. To investigate this effect, we have simulated Case B assuming a much steeper transition: 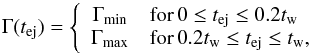 (10)where the value 0.2tw has be chosen to have the same mean Lorentz factor than in the reference cases. For such initial conditions, the internal shock phase starts earlier, and the shocks are immediately stronger than in the reference cases as shown in Fig. 12. The corresponding efficiency is increased, and therefore, we have adjusted the injected kinetic power to keep the same radiated energy as in the reference cases (see Table 1). As expected, that the shock is initially stronger affects the rising part of the pulse: see Fig. 13 (light curves, pulse width, and time lags) and Table 1. The main change is the increase in the time lags, which become too long compared to observations. However, we checked that, as for the reference case, a varying fraction of accelerated electrons ζ ∝ ϵ∗ solves this problem (Fig. 13, middle panel). We conclude that the main effect of the shape of the initial distribution of the Lorentz factor is on the rising part of the pulse, especially at high energy as discussed in Sect. 6.
Another effect is also related to the initial distribution of the Lorentz factor. As can be seen in Fig. 1, the decaying part of the light curve is interrupted at tHLE,obs with a break towards a steeper decline. Such breaks are usually not observed, which can be easily understood because complex GRB light curves show the superimposition of many pulses, which makes observing the very end of the decay of a pulse difficult. We note, however, that tHLE,obs is directly related to the radius where the propagation of the internal shocks responsible for the pulse ends (Hascoët et al. 2012). In the reference case, it can easily occur at later times by simply increasing the duration of the phase of the relativistic ejection where Γ = 400, as illustrated in Figs. 11 and 9 where it assumed that the Γ = 400 phase in the ejection lasts for 2.2 s instead of 1.2 s. The pulse is exactly the same except for the break in the decay at tHLE,obs ≃ 9 s instead of 5.4 s. It slightly affects the HIC and the HFC (Fig. 9), but at late times where the flux is too low to be considered in observed HIC diagrams.
We do not discuss here two other factors also related to the initial distribution of the Lorentz factor: (i) the contrast Γmax/ Γmin has a direct impact on the collision radius and on the strength of the shock. Very high contrasts may appear unrealistic for central engine models, and very low contrasts lead to internal shock efficiencies that are too low. We have favoured here an intermediate value leading to a total efficiency of 1 − 5% (ratio of the radiated energy over the kinetic energy): see also Bošnjak et al. (2009) and Fig. 8.d therein; (ii) the mean value  of the initial Lorentz factor in the ejecta. The main effects of this parameter are on the peak energy (Ep,obs decreases if increases, all other parameters being constant, Barraud et al. 2005; Bošnjak et al. 2009) and at high energy (γγ annihilation, see Sect. 6).
5.2. Effect of the injected kinetic power
The reference cases are computed using the simple assumption that the injected kinetic power Ė is constant during the relativistic ejection, which corresponds to an ejected mass flux that evolves as Ṁ ∝ 1/Γ. Other assumptions are of course possible and can again affect the dynamics and the predicted spectral evolution. To investigate this possibility, we simulated Case B assuming a constant ejected mass flux Ṁ, i.e. Ė ∝ Γ. We fixed the value of Ṁ so that the total radiated energy is the same in both cases, and we adjusted ζ to have similar peak energies. A clear drawback of the Ṁ = cst assumption, as already explained in Kobayashi et al. (1997) and Daigne & Mochkovitch (1998), is a lower internal shock efficiency, which leads to increase Ė to have the same GRB fluence (see Table 1). As seen in Fig. 12, the impact on the dynamics is weaker than in the case studied in Sect. 5.1. The qualitative comparison with observations (see Fig. 14 and Table 1) shows that the pulse shape is improved, especially the values of the time lags (Obs. #3) and the evolution of the pulse width with energy (Obs. #2). The HIC (Obs. #5) is also slightly improved. There is also a weak impact on the high-energy emission in the LAT range that is discussed in Sect. 6.
5.3. Effect of the duration of the relativistic ejection
We have not commented yet on the evolution of the pulse properties with duration. Observations show that pulses of short duration are more symmetric (Obs. #1), have very short or no time lags (Obs. #3), and are harder (Obs. #7), for a large part owing to higher peak energies as shown by the analysis of three bright GBM short GRBs (Guiriec et al. 2010). The internal shock model reproduces these observations qualitatively well (Daigne & Mochkovitch 1998). Short GRBs have similar luminosities to long GRBs (Nakar 2007), so it is reasonable to assume similar kinetic power Ė. Short GRBs emit MeV photons like long GRBs (see e.g. Guiriec et al. 2010) and even GeV photons in the case of GRB 090510 (Ackermann et al. 2010). Then, one would also expect similar Lorentz factors. The main difference seems to be simply limited to the shorter duration and, more generally, to a compression of all variability timescales (Guiriec et al. 2010; Bhat et al. 2012). If all input parameters are kept constant except for the timescales, a simple – two-shell collision – model of the internal shock phase (see e.g. Barraud et al. 2005) shows that the radius and comoving mass density evolve as R ∝ tvar and  , where tvar is the variability timescale, and that Γ∗ and ϵ∗ are unchanged. Then Eq. (3) shows that Lbol is not affected but Eq. (5) indicate that
  : shorter pulses are naturally expected to have higher peak energies. An increase in Ep,obs has a direct impact on the second factor in Eq. (9) (spectral correction) and then affects many observed features, such as the time lags and the pulse width, as illustrated in all the examples shown in this paper. A secondary effect can also play a role. The parameter wm also evolves with the variability timescale, as
  , so the importance of the Klein-Nishina corrections should increase when the duration decreases, which can affect the general spectral shape and especially the low-energy photon index: see Fig. 8d in Bošnjak et al. (2009).
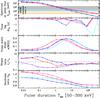 |
Fig. 15 Effect of the duration of the ejection. The peak energy at the maximum of the pulse (top panel), the difference between the time of maximum in BATSE channel 3 and 1 (second panel), the index of the power law giving the evolution of the pulse width with energy a = − dlnW/ dlnE (third panel), the ratio of the rise and decay time of the pulse in BATSE channel 2+3 (fourth panel), and the hardness ratio H32 (ratio of the photon fluence in BATSE channel 3 over the photon fluence in BATSE channel 2) are plotted as a function of the duration T90 in BATSE channel 2+3 for Case A with a constant (blue) or varying (cyan) ζ , and Case B with a constant (red) or varying (magenta) ζ, with p = 2.7 in all cases. The other model parameters are constant and equal the values given in Table 1, except for the duration of the ejection tw, which is varied from 2 ms to 200 s. |
To test the predicted pulse evolution with duration in more detail, we computed a series of synthetic pulses keeping the same parameters as in the reference cases A et B (Γmin, Γmax, Ė, and microphysics parameters), except for the duration tw that varies from 2 ms to 200 s. We also performed the same series of simulations for Cases A and B with a varying fraction of accelerated electrons ζ, as discussed in Sect. 4.2, and for each series, we considered both the case with p = 2.5 and the one with p = 2.7. The results for p = 2.7 are shown in Fig. 15, where we plot the evolution of different features of the pulse as a function of the duration T90 measured between 50 and 300 keV (BATSE channels 2+3). As predicted, and in agreement with observations, we find that (i) shorter pulses have higher peak energies; (ii) short pulses have negligible time lags. Indeed the peak energy is well above BATSE channel 4, and all light curves in the low gamma-ray range (BATSE) correspond to the same part of the synchrotron spectrum; the spectral correction in Eq. (9) is constant with time for all channels. Similar behaviour is observed at very long duration because the peak energy is below the spectral range of BATSE channel 1 (such an evolution is more difficult to test with observations as very long pulses are rare); (iii) for the same reason, short pulses have the same width in all BATSE channels, a → 0; (iv) for the same reason, short pulses have more symmetric shapes (i.e. the pulse decay time becomes comparable to the rise time). We notice that for constant ζ, the effect is too strong, with the shortest pulses having a rise time time longer than the decay time, which is sometimes observed but remains rare. The case with a varying ζ shows much better agreement with observations; (v) short pulses have a higher hardness ratio H32. This indicator was used to identify the hardness-duration relation in Kouveliotou et al. (1993). It depends mainly on Ep,obs, and therefore the observed trend is reproduced. At very short durations, since Ep,obs is above the spectral range of BATSE channel 3, the hardness ratio becomes constant and has a value that depends only on α, i.e. H32 → (3001 + α − 1001 + α)/(1001 + α − 501 + α). It is therefore distinct for Case A (α ≃ − 1.5 and H32 → 1.02) and Case B (α ≃ −1.2 to 1.1 and H32 → 1.33 to 1.45).
To make a more realistic test of the predictions of the internal shock model as a function of duration, one should consider multi-pulse light curves, which is beyond the scope of this paper. However, our results show clearly that it predicts the observed hardness-duration relation Obs. #7 correctly and that the other properties (symmetry of short pulses, Obs. #1 and Obs. #2; vanishing lags for short GRBs, Obs. #3) are also explained as a consequence of higher peak energies at short duration.
6. High-energy signatures (>100 MeV)
We have described in the previous section how the different assumptions in the internal shock model (dynamics or microphysics) can affect the temporal and spectral properties of pulses in the soft gamma-ray range. Is it possible to distinguish among the different possibilities from the high-energy emission above 100 MeV? The few bursts detected by Fermi-LAT show several interesting features (Ackermann et al. 2013): (i) LAT GRBs are among the brightest ones detected by the GBM, with the exception of a few cases (e.g. GRB 081024 or GRB 090531). The measured Eiso in the subsample of bursts with a measured redshift shows that the LAT bursts are intrinsically brighter. The ratio of fluences in the high (>100 MeV) and low (<1 MeV) energy channels is ≲20%. The highest energy photons (>10 GeV) are coming from the highest fluence GRBs (080916C, 090510, 090902B); (ii) several LAT GRBs require an extra power-law component in addition to the Band model in the high-energy portion of the spectrum. It can make a significant contribution to the total energy budget (10%−30%) and becomes prominent at energies Eobs ≳ 100 MeV. The slope of the power law lies within the range −2 to −1.6; (iii) the emission above 100 MeV systematically starts later with respect to the GBM light curve. The ratio of the time delay over the total duration in the GBM is greater for longer bursts. In long GRBs, e.g. GRB 080916C, the typical delay is a few seconds, while it is less than one second in short GRBs, e.g. ~0.5 s and 0.05 s in GRB 090510 or GRB 081024B, respectively; (iv) the emission in the LAT is long-lasting compared to the GBM. It decays smoothly with time and can be fitted with a power law, Fν ∝ t− α with α close to 1 in most of the cases. A break in the decay of the extended emission is detected in GRB 090510, GRB 090902B, and GRB 090926A, with a transition from α ≃ 2.2 to 0.9.
The LAT long-lasting emission indicates that the high-energy emission in GRBs has, at least at late times, an external origin, i.e. is due to the deceleration of the ejecta by the external medium (Kumar & Barniol Duran 2009, 2010; Gao et al. 2009; Ghisellini et al. 2010; Wang et al. 2010, 2013). On the other hand, several arguments suggest that there is also a contribution of internal origin at early times: (i) a break in the temporal decay of the LAT emission is observed in at least three bright GRBs close to the end of the prompt emission in the GBM and suggest a change in the dominant mechanism (Ackermann et al. 2013); (ii) the LAT emission at early times is known to be variable. For instance, variability on the 100 ms (resp. 20 ms) timescale is found in GRB 090902B (resp. 090510). This is difficult to reconcile with an external origin. As emphasized by Beloborodov et al. (2014), there is an additional theoretical argument against the scenario where the whole LAT emission (prompt and long-lasting) would be associated to the external shock (rise and decay): when using large time-integration bins, the LAT flux starts to decay well before the end of the prompt emission in GBM, whereas the self-similar stage of the blast wave cannot be reached at such early times (typically, not earlier than the duration of the prompt emission).
In the following we examine which of the properties of the early high-energy emission in GRBs can be accommodated within the internal shock model and whether the LAT observations may offer a way to distinguish among the different scenarios studied in the two previous sections. We do not consider the possible contribution of shock-accelerated protons to the emission, since various studies have shown that it requires extreme parameters to be dominant in the LAT range, owing to weak efficiency (Asano et al. 2009; Asano & Mészáros 2012). We do not include additional processes that may be important, such as the scattering of photospheric photons by shock-accelerated electrons in internal shocks (Toma et al. 2011) or the scatterings of prompt photons in the pair-enriched shocked external medium in the early stages of the deceleration (Beloborodov et al. 2014).
6.1. High-energy emission in reference cases A and B
As illustrated in Fig. 16, Cases A and B, with a constant or a varying ζ, have very different high-energy spectra because the efficiency of inverse Compton scatterings strongly depends on ϵB/ϵe. The inverse Compton component is negligible in Case A, whereas it creates a well defined additional component at high energy in Case B. This additional component is stronger when ζ is constant. As shown in Sect. 4.2, the peak energy of the synchrotron component is decaying faster in this case, so that Klein-Nishina corrections become more and more negligible in the pulse decay. On the other hand, the assumption ζ ∝ ϵ∗ maintains a higher value of the peak energy during the decay, and then a less efficient inverse Compton emission. It is interesting to note that the additional component in the GeV range is very flat in the νFν spectrum (see Fig. 16 bottom left panel) and would probably be fitted by a power law with a photon index close to −2, as observed in several LAT bursts (Ackermann et al. 2013).
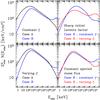 |
Fig. 16 High-energy emission: spectra. The time-integrated spectrum (0–15 s) is plotted from the keV to the GeV range for the same cases as in Fig. 18. Top left panel: reference Cases A and B. Bottom left panel: Cases A and B with a varying accelerated electron fraction ζ. Top right panel: Case B with a sharp initial distribution of the Lorentz factor (see text) and a constant or a varying accelerated electron fraction ζ. Bottom right panel: Case B with a constant ejected mass flux (see text) and a constant or a varying accelerated electron fraction ζ. |
These examples cannot be directly compared to Fermi-LAT bursts because they radiate ~1052 erg, whereas LAT bursts are much brighter (Ackermann et al. 2013). In addition, we did not try to adjust the model parameters to improve the peak energy of the additional component. In our examples, the additional component typically appears above 1−10 GeV, whereas it is already detected at lower energy in LAT bursts. The shape of the additional component and its peak energy are determined in a complex manner by the relative efficiency of the synchrotron and inverse Compton emission, the slope p of the shock-accelerated electrons, and the γγ annihilation. This is illustrated in Fig. 17 where the spectrum in Cases A and B is plotted for two different values of p, which directly affects the photon index β of the high-energy part of the dominant (synchrotron) component. Increasing p and β allows the emergence of the additional component at lower energy to be observed and affects its measured slope.
Owing to the high peak energies of the inverse Compton component in our reference cases, the light curves above 1 GeV are mainly governed by the synchrotron radiation and peak approximatively at the same time as the soft gamma-ray component, with only a very short delay (see Fig. 18), unlike the observed delayed onset of the GeV emission (Ackermann et al. 2013). To increase this delay, one should either increase the γγ annihilation in the early phase by decreasing as illustrated in Hascoët et al. (2012), or adjust the parameters so that the inverse Compton emission peaks at lower energy (see e.g. Asano & Mészáros 2012), or both. Nevertheless, in Case B with a constant ζ, where the inverse-Compton emission is the most efficient, the additional component starts to be visible in the light curve during the pulse decay (see Fig. 18, right, top panel). One also sees a small high-energy precursor that appears because the shock is initially weak, with a low peak energy and a high inverse-Compton efficiency (Bošnjak et al. 2009). This precursor, never observed in LAT GRBs, can be suppressed by changing either the assumptions for the microphysics or the dynamics (Fig. 18).
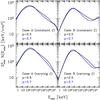 |
Fig. 17 High-energy emission: effect of the electron slope p. The time-integrated spectrum (0–15 s) is plotted from the keV to the GeV range for reference Cases A (left panels) and B (right panels), either assuming a constant (top panels) or a varying (bottom panels) fraction ζ of accelerated electrons, with p = 2.5 (black) or 2.7 (blue). |
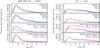 |
Fig. 18 High-energy emission: light curves. The light curves in the soft gamma-ray range (260 keV–5 MeV, left figure) and in the high-energy gamma-ray range (>1 GeV, right figure) are plotted for different cases discussed in the paper. For the high-energy light curves, a thin solid line indicates that the synchrotron emission is dominant above 1 GeV whereas a thick solid line indicates that the inverse-Compton emission is dominant. Top panel: reference Cases A and B; Second panel: Cases A and B with a varying accelerated electron fraction ζ; Third panel: Case B with a sharp initial distribution of the Lorentz factor (see text) and a constant or a varying accelerated electron fraction ζ; Bottom panel: Case B with a constant ejected mass flux (see text) and a constant or a varying accelerated electron fraction ζ. |
6.2. Impact of the assumptions on the dynamics
The assumptions for the dynamics have a strong impact on the high-energy emission. In the case Ṁ = cst (rather than Ė = cst), the inverse-Compton emission is more efficient during the pulse decay (but not during the rise, as in reference Case B). This is due to a more rapid decrease in the peak energy during the decay (see Fig. 12) and therefore a more rapid decrease of the Klein Nishina corrections. This improves the light curves (Fig. 18 bottom panels), which show a more intense tail due to inverse Compton emission, and a longer delay between the peaks of the LAT and GBM light curves, however still too small to explain the observed delayed onset. The additional component in the spectrum is already detected between 1 GeV and 10 GeV (Fig. 16).
The case where the initial distribution of the Lorentz factor has a sharp transition from Γmin to Γmax has the strongest impact. In this case, the shocks are immediately violent so that the weak precursor observed in the LAT in other cases does not appear (see Fig. 18): the peak energy of the “forward” internal shock is indeed immediately very high and the corresponding inverse Compton emission is suppressed by Klein-Nishina corrections. It is only at late times that the inverse Compton emission becomes bright when more scatterings occur in Thomson regime. However, an important difference in this case is that the emission of the “forward” internal shock lasts longer and is not negligible (see Fig. 12). It is even dominant in the LAT for the first seconds. Thanks to a lower peak energy, the corresponding additional high-energy component is seen in the LAT well, either with a constant accelerated electron fraction ζ, or even more with a varying ζ, which is the only simulated case in all the examples presented in this paper where the choice of parameters immediately leads to a peak energy of the IC component at 10 GeV (see Fig. 16). For this reason, this case is the brightest in the LAT range, and it illustrates that the high-energy emission from internal shocks is not only sensitive to the details of the assumptions regarding the microphysics but also to the dynamics.
Interestingly, we note that in most of the scenarios discussed in Sect. 6, the plots showing the time lag with respect to the low-energy channel as a function of the energy (Figs. 3, 7, 11, 13, 14) shows a U-shape, the light curves initially peaking earlier when the energy is increasing, with a reversal of this trend above ~10−100 MeV. Such behaviour is found in GBM+LAT data, as studied by Foley et al. (2011) and Foley (2012).
We conclude that the high-energy emission from internal shocks is highly sensitive to the details of the assumptions regarding both the microphysics and the dynamics and can therefore provide valuable diagnostics to distinguish among the various scenarios discussed in this paper. However, a direct comparison of our results with observations reveals itself to be delicate because LAT GRBs are among the brightest, with isotropic energies much larger than the average “typical” value considered here. Since this paper is mainly focussed on the temporal and spectral properties in the soft gamma-ray range, we leave a more detailed comparison to Fermi data to a forthcoming study, which will be based on simulated bursts with more extreme parameters, especially regarding the total injected energy and the Lorentz factor.
7. Discussion
The spectro-temporal evolution in the internal shock model is governed by the hydrodynamics: the physical conditions in the shocked regions vary on the hydrodynamical timescale associated to the propagation of the internal shocks. This evolution affects the respective efficiency of the radiative processes (synchrotron radiation, inverse Compton scatterings) in a complex manner, as well as the peak energy and spectral shape of each component. The model parameters can be divided into two groups: assumptions for the microphysics and for the dynamics. Both can strongly affect the spectro-temporal evolution in GRBs.
7.1. Impact of the microphysics parameters
The dissipation of the energy in the shocked region is parameterized by (ϵe,ζ,p) describing the energy injection in the relativistic electrons distribution and ϵB describing the amplification of the magnetic field. The values of these microphysics parameters are broadly constrained by the observations. Since GRBs are extremely bright, a high ϵe is required to avoid an energy crisis. As Fermi-LAT observations are not compatible with an SSC spectrum (Piran et al. 2009), the soft gamma-rays must be directly produced by synchrotron radiation, which requires a low fraction of accelerated electrons ζ ≲ 10-3−10-2 (Daigne & Mochkovitch 1998; Bošnjak et al. 2009; Daigne et al. 2011; Beniamini & Piran 2013). That the observed low energy index α is usually larger than the standard synchrotron fast cooling value −3/2 favours low values of ϵB, typically ϵB ≲ 10-3−10-4 (Daigne et al. 2011; Barniol Duran et al. 2012), if such photon indices are mainly due to the effect of inverse Compton scattering in the Klein Nishina regime. That many bursts show also a steep high-energy photon index β or are even well fitted with a power law + an exponential cutoff (Kaneko et al. 2006; Goldstein et al. 2012) implies that the electron slope p can be steeper than the usually considered value p ≃ 2.2−2.5.
We find that the spectro-temporal evolution predicted by the internal shock model qualitatively agrees with the observations. This is illustrated by the two reference Cases A and B defined in Daigne et al. (2011) and corresponding to ϵe = 1/3, a low ζ, p = 2.5 and either a high or a low ϵB, leading to a standard α ≃ −1.5 or a large α ≃ −1.1 low-energy photon index for the synchrotron spectrum, respectively. The pulse shape is asymmetric and has a faster rise than the decay, the pulse width is larger in lower energy channels, and the pulse maximum is reached at earlier times for higher energy channels. The typical hard-to-soft evolution is reproduced during the pulse decay.
We investigated whether a quantitative agreement can be achieved, since the observed spectrum evolves too rapidly for the reference Cases A and B. We studied the effect of the electron distribution slope (Fig. 6) and found that p ≃ 2.7 (slightly steeper than the common assumption p = 2.5) improved the evolution of the spectral peak energy, especially in Case B (low magnetic field, large α ≲ − 1). Such steeper values are also in better agreement with observed high-energy photon indices β. However, the evolution of the peak energy usually remains too rapid compared to observations. This problem had already been identified by Daigne & Mochkovitch (1998, 2003) based on a much simpler treatment of the radiative processes. They also suggested that this may be related to the common assumption of constant microphysics parameters during the evolution of the shocks, which may appear unrealistic. To investigate the impact of these assumptions, they considered a simple prescription for varying microphysics parameters – in the absence of still missing physically motivated prescriptions based on shock acceleration theory – where the fraction of accelerated electrons is evolving with the shock Lorentz factor, such as ζ ∝ ϵ∗. We simulated the spectro-temporal evolution predicted by the internal shock model under such an assumption. This indeed leads to much better quantitative agreement: the evolution of the peak energy is slower, and, because it governs most of the other properties, the general agreement is much better for the hardness intensity correlation, the evolution of the pulse shape, and time of pulse maximum with energy channels, etc. (see Sect. 4 and Figs. 9 and 11).
7.2. How realistic are our assumptions for the microphysics?
There are no theoretical arguments for why microphysics parameters should be universal in mildly relativistic shocks (see e.g. Bykov et al. 2012). Even in the ultra-relativistic regime, GRB afterglows already show the opposite, since a broad distribution of parameters is needed to fit the observations (see e.g. Panaitescu & Kumar 2001; Cenko et al. 2010). In the absence of a well established shock theory, we have tested here variations following the prescription ζ ∝ ϵ∗, which is suggested by the work of Bykov & Meszaros (1996). Our result that varying microphysics parameters improves the quantitative agreement between the predictions of the internal shock model and the observed spectro-temporal evolution observed in GRBs is therefore encouraging. On the other hand, some of the typical values of the microphysics parameters in the simulations presented in this paper may appear unrealistic, compared to recent results in shock acceleration modelling, especially those from large particle-in-cell (PIC) simulations. Steep p ≃ 2.7 and large ϵe ≃ 0.1 − 0.3 may be achieved, but on the other hand, low accelerated electron fraction ζ ≃ 10-4 − 10-2 and low magnetic field energy fraction ϵB ≃ 10-3 may appear to contradict shock simulations, as mentioned for instance by Barniol Duran et al. (2012); Beloborodov (2013); Beniamini & Piran (2013). This calls for several comments:
-
(i)
Current PIC simulations are limited to ultra-relativistic shocks and do yet not describe the parameter space of mildly relativistic shocks such as in internal shocks, i.e. with typical shock Lorentz factors γsh ≲ 2. A direct comparison is therefore difficult. For γsh = 15, PIC simulations show that acceleration does not occur for magnetized (σ ≳ 10-3) perpendicular shocks, but is observed either for weakly magnetized or quasi-parallel “subluminal” shocks typically with ϵe ~ 0.1, ζ ~ 10-2 and p ≃ 2.3 − 2.4 (Martins et al. 2009; Sironi & Spitkovsky 2011).
-
(ii)
These PIC simulations predict a low value of ζ ~ 10-2. Theoretical investigations of the energy transfer from protons to electrons in mildly relativistic shocks also predict that only a fraction of electrons are accelerated, with ζ as low as 10-3 (Bykov & Meszaros 1996). Therefore the values of the accelerated electron fraction ζ in the simulations discussed here do not strongly contradict shock acceleration modelling, but are usually too low. The low values of ζ in our simulations are necessary to reach high peak energies for the synchrotron component. However, a detailed comparison between the ballistic (“solid shells” model) approach used here for the dynamics of internal shocks with a more precise calculation based on a 1D Lagrangian special relativistic hydrocode shows that the agreement between the two calculations is usually very good, except for the mass density ρ∗ and specific internal energy density ϵ∗ in the shocked region, which are underestimated by the simple model (Daigne & Mochkovitch 2000). For similar Lorentz factor Γ∗ microphysics parameters ϵe, ζ, p, and ϵB, higher values of ρ∗ and ϵ∗ lead to a higher peak energy. Since ρ∗ is typically underestimated by at least a factor ~103 and ϵ∗ by a factor ~4 in the initial phase of the shock propagation that dominates the pulse emission (see Fig. 5 in Daigne & Mochkovitch 2000), the values of ζ deduced from the simple dynamical model may be underestimated by a factor ≳103/4 × 45/4 ≃ 30 as
 (see Eq. (5)). When taking this effect into account, the cases listed in Table 1 would correspond to the range ζ ~ (1 − 10)%, in better agreement with theoretical predictions. In addition, we have simulated very smooth single-pulse bursts for simplicity, and to better identify the spectro-temporal evolution but more variable outflows would lead to more efficient collisions with higher values of the dissipated specific internal energy ϵ∗, allowing reaching high peak energies for higher values of ζ.
 -
(iii)
Shock acceleration is accompanied by the amplification of the magnetic field in the shocked region. Both processes cannot be dissociated. Therefore, the low values of ϵB considered in reference case B and the derived cases may appear unrealistic, as discussed in Barniol Duran et al. (2012). However, one should remember that ϵB should be understood here as fixing the typical strength of the magnetic field seen by radiative electrons, i.e. on a length scale fixed by the electron radiative timescale. This length scale is much larger than the plasma scale, and ϵB is therefore not only determined by the amplification at the shock, but also by the evolution of the magnetic field on larger scales. Recently, Lemoine (2013) has demonstrated that if the large magnetic field generated in a thin microturbulent layer at the shock front decays over some hundreds of skin depths – as suggested by recent simulations (Keshet et al. 2009) – the effective ϵB deduced from observations may be much lower than the value predicted by PIC simulations at the shock (see also Derishev 2007; Kumar et al. 2012; Uhm & Zhang 2014). In addition, the low value of ϵB used in Case B is required to favour inverse Compton scatterings in the Klein-Nishina regime and to increase the low-energy slope of the synchrotron spectrum (see Daigne et al. 2011 for a discussion of the detailed conditions). As discussed below (Sect. 7.4), the precise shape of the observed spectrum on the low-energy part of the gamma-ray range is still being debated (see e.g. Guiriec et al. 2011). If it happens that the occurrence of large photon indices (α ≳ − 1) is over-estimated by current spectral analyses, the constraint on ϵB would be relaxed and higher values could be considered.
7.3. Impact of the dynamical parameters
The dynamics of the relativistic outflow is determined by the initial conditions described by the variation in the bulk Lorentz factor of the flow Γ(tej), the kinetic power Ė(tej), and the duration of the relativistic ejection tw. Since the spectral evolution is mainly governed by the details of the propagation of the internal shock waves, any change in the initial Lorentz factor or kinetic power directly affects the light curve shape (see Figs. 13 and 14). Typically, we find that steeper variations of the Lorentz factor lead to internal shocks which are immediately efficient, with a peak energy that is already high at early times in the pulse. The biggest impact is an improvement of the light curve at high energy (GeV range) compared to Fermi observations, as illustrated in Fig. 18. Changing the assumptions on the injected kinetic power also affects the results, mostly at high energy, and can affect the overall efficiency of the internal shock phase.
Unfortunately, the current understanding of GRB central engines and of the relativistic ejection phase does not allow a detailed prediction of the input parameters Γ(tej) and Ė(tej). We can investigate which assumptions favour the best agreement with observations, but we lack physical arguments to decide if these assumptions are realistic and – when different assumptions lead to a similar agreement – which assumption should be preferred.
We have also tested an interesting property of the internal shock model: the dependence of the temporal and spectral properties on the duration of a pulse. For that purpose, we simulated a series of pulses, keeping all parameters constant except for the total duration of the relativistic ejection, tw. It is very encouraging to observe that, despite its simplicity (in reality, variations in tw are probably accompanied by variations of other input parameters), the model reproduces the observations well: short pulses become more symmetric, have smaller or zero time lags, and have a higher hardness ratio (see Fig. 15). This is mainly because the peak energy is higher when the variability timescale is shorter, a clear prediction of the internal shock model. At very short duration, most of the pulse light curve in the soft gamma-ray range occurs in the same portion of the spectrum (below the peak energy), which explains why the lags vanish and the hardness ratio tends to be constant. All these properties of short pulses have been observed in real GRBs since the BATSE era and have been confirmed by Fermi (Guiriec et al. 2011, 2013), which in addition has shown the dominant effect of higher peak energies to explain this evolution in short pulses.
7.4. Possible extensions of this work
There are several potential additional effects that are not taken into account in this work but should be examined in the future.
-
We have shown in Sect. 6 that the different sub-scenarios of the internal shock model may differ by their predictions for the high-energy gamma-ray emission. However, a special modelling effort is needed to compare these predictions to observations, since Fermi-LAT bursts are amongst the brightest GRBs ever detected, whereas the pulses simulated here have average properties.
-
Recent Fermi-GBM observations have shown disagreement in the soft gamma-ray range between the observed spectrum and the phenomenological Band function (Band et al. 1993) usually used for spectral fits (Guiriec et al. 2011; Axelsson et al. 2012; McGlynn et al. 2012; Guiriec et al. 2013). This leads to reconsidering the distribution of the low-energy photon index α, because it is usually found in these bright GBM bursts that adding a new spectral component at low energy to reproduce the spectral shape better leads to lower values of α. As discussed above, this relaxes the constraint on one microphysics parameter, ϵB. A promising interpretation for these new observations is that an extra component associated to the photospheric emission is detected, in agreement with theoretical predictions (Guiriec et al. 2011, 2013). A possible diagnostic to distinguish amongst the different scenarios discussed here would be to simultaneously simulate the photospheric and internal shock emission, because the predicted spectral evolution for these two components does not have the same dependence on the properties of the relativistic outflow (Hascoët et al. 2013).
-
To be able to explore a wide range of the parameter space, some simplifications were made in the present calculations. There are several possible improvements that may be investigated in the future: (i) what is the contribution to the emission of the thermal electrons that are not shock-accelerated (see e.g Giannios & Spitkovsky 2009). This depends of course on the fraction
 of the dissipated energy that remains in the fraction 1 − ζ of electrons that are not accelerated. We checked that for
  , the additional component due to the emission of the thermal electrons does not affect the gamma-ray spectrum, and therefore does not change the results of the present paper. On the other hand, it may contribute in certain conditions to the prompt optical emission. We note that the absence of a clear signature of thermal electrons in afterglow observations may indicate that the ratio
  is not very high in relativistic shocks. (ii) What is the contribution to the emission of the secondary leptons produced by γγ annihilation? As shown by Asano & Mészáros (2011), this could make an important contribution to the observed extra power-law component identified by Fermi-LAT. In addition, a more precise calculation of the γγ annihilation may help for reproducing the delayed onset of the GeV light curve better, which was also identified by Fermi (Hascoët et al. 2012). (iii) What is the effect of the injection timescale of the accelerated particles? A slow injection may improve the spectral shape at low energy, as investigated recently by Asano & Terasawa (2009). (iv) What is the effect of a decaying magnetic field behind the shock front? Such an evolution is expected from shock acceleration modelling and may improve the shape of the synchrotron spectrum (increasing low-energy photon index) without implying values of ϵB that are as low as what is considered in this paper (see e.g. Derishev 2007; Wang et al. 2013).
8. Conclusions
Motivated by the results from the Fermi satellite that significantly extend the spectral coverage of the GRB phenomenon and particularly improve the spectral analysis of the prompt emission, we investigated the origin of the observed spectral evolution in GRBs. We presented the results of a set of numerical simulations of the GRB prompt emission in the framework of the internal shock model. We made a detailed comparison of the model predictions with the observed temporal and spectral GRB properties in the soft gamma-ray range. We focussed on the simplest case of a single pulse burst associated to the synchrotron radiation from shock-accelerated electrons in the internal shocks formed after the collision between a “fast” and a “slow” region in an ultra-relativistic ejecta. We considered three reference cases with a duration of 2−3 s, an isotropic radiated energy of 1.9 × 1052, 1.3 × 1052, and 1.3 × 1051 erg, a peak energy of 730, 640, and 160 keV, and a low-energy photon index of −1.5, −1.1, and −0.7, respectively.
We show that many observed properties or common trends – namely (i) the pulse asymmetry; (ii) the energy-dependent pulse asymmetry (evolution of the pulse width with energy channel); (iii) the time lags between the light curves in different energy channels; (iv) the hard-to-soft evolution within pulses; (v) the hardness-intensity correlation; (vi) the hardness-fluence correlation – can be accounted for and are governed by the details of the spectral evolution, i.e. the evolution of the peak energy and the spectral slopes.
We showed that there is qualitative agreement between the model results for our three reference cases and the large set of observations listed above. With a comprehensive set of simulations, we demonstrated that a quantitative agreement can be achieved under some constraints on the model parameters. We distinguished between the effects of the microphysics (details of the energy distribution in shocked regions) and the dynamical parameters (initial conditions in the outflow). We found that the agreement with the observed spectral evolution can be significantly improved if (i) the distribution of shock-accelerated electrons is steeper than what is usually assumed, with a slope p ≳ 2.7; (ii) the microphysics parameters vary with the shock conditions in a manner that reduces the dependency of the peak energy on the shock conditions. It is illustrated here by the case where the fraction of accelerated electrons increases for stronger shocks; (iii) the initial variations in the Lorentz factor in the outflow are steeper. An additional advantage of this assumption is the increase in the efficiency of internal shocks; (iv) the relativistic ejection proceeds with a constant mass flux rather than a constant kinetic energy flux. A drawback of this last possibility is the reduced efficiency of the shocks. Since the microphysics parameters are not well constrained by the current stage of shock acceleration modelling in the mildly relativistic regime relevant for internal shocks and the initial conditions in the outflow are also poorly constrained due to many uncertainties regarding the mechanism responsible for the relativistic ejection by the central engine, we cannot conclude that one of these four possibilities may be expected or should be preferred.
We also specifically investigated the impact of the duration of the relativistic ejection, because many of the properties listed above are known to evolve with pulse duration. The internal shock model naturally predicts a higher peak energy for short pulses, and possibly a harder photon index due to a deeper Klein-Nishina regime for inverse-Compton scatterings. We showed that – in agreement with observations – this leads to a hardness-duration correlation and to the following consequences: pulses become more symmetric with almost no evolution of the pulse width with energy, and with very short or zero lags. The prompt emission from short GRBs could then be due to the same mechanism as in long GRBs, but for different model parameters because all timescales are contracted, probably because of a different central engine.
Finally, we investigated the signature at high-energy (Fermi-LAT range). In this domain, the observed flux is made of the high-energy tail of the synchrotron component and a new component produced by inverse Compton scattering. A direct comparison with Fermi-LAT results is not possible because LAT bursts are among the brightest, whereas we have simulated here average pulses. However, we note qualitative agreement with data: owing to the evolving efficiency of the scatterings – they usually occur in the Klein-Nishina regime at early times and enter the Thomson regime during the pulse decay – the resulting emission at high energy can differ significantly from the keV−MeV range; specifically, the rise of the light curve is delayed and the emission lasts longer. This leads to a U-shape curve when plotting time lags with respect to the low-energy channel as a function of energy, in agreement with GBM+LAT observations. However, we do not have a quantitative agreement: the onset of the high-energy light curve is not delayed enough. Interestingly, some of the effects listed above – a steeper electron slope, a varying electron acceleration fraction, and especially steeper variations of the initial Lorentz factor – also have a positive impact on the properties of the high-energy emission. The time-integrated spectrum at high energy depends strongly on the efficiency of the inverse Compton scatterings. In some cases, it is found to be very close of the extrapolation of the MeV component, possibly with a cutoff at high energy. In other cases, it clearly shows an additional component, which can either be rising (photon index greater than −2) or flat (photon index close to −2). Since there are significant differences between the various scenarios discussed in the paper, this motivates a specific comparison to Fermi-LAT bursts that will hopefully provide diagnostics that distinguish amongst the various theoretical possibilities.
This study illustrates the capacity of the internal shock model to reproduce most of the observed properties of the GRB prompt emission related to the spectral evolution, both for long and short bursts. Our conclusions are limited by many uncertainties in the ingredients of the model, namely the details of the microphysics in mildly relativistic shocks and the initial conditions in the GRB relativistic outflows. However, in a more optimistic view, we showed that the poorly understood physics may have a detectable imprint on GRB data, which should allow for some progress in the future.
See Daigne et al. (2011) for a correspondence between the notations of Nakar et al. (2009) and Daigne et al. (2011) and a comparison.
Acknowledgments
The authors thank R. Mochkovitch for many valuable discussions on this work and a careful reading of the manuscript. F.D. and Z.B. acknowledge the French Space Agency (CNES) and the French Program for High Energy astrophysics (PNHE) for financial support.
References
- Ackermann, M., Asano, K., Atwood, W. B., et al. 2010, ApJ, 716, 1178 [NASA ADS] [CrossRef] [Google Scholar]
- Ackermann, M., Ajello, M., Asano, K., et al. 2013, ApJS, 209, 11 [NASA ADS] [CrossRef] [Google Scholar]
- Asano, K., & Mészáros, P. 2011, ApJ, 739, 103 [NASA ADS] [CrossRef] [Google Scholar]
- Asano, K., & Mészáros, P. 2012, ApJ, 757, 115 [NASA ADS] [CrossRef] [Google Scholar]
- Asano, K., & Terasawa, T. 2009, ApJ, 705, 1714 [NASA ADS] [CrossRef] [Google Scholar]
- Asano, K., Inoue, S., & Mészáros, P. 2009, ApJ, 699, 953 [NASA ADS] [CrossRef] [Google Scholar]
- Atwood, W. B., Abdo, A. A., Ackermann, M., et al. 2009, ApJ, 697, 1071 [NASA ADS] [CrossRef] [Google Scholar]
- Axelsson, M., Baldini, L., Barbiellini, G., et al. 2012, ApJ, 757, L31 [NASA ADS] [CrossRef] [Google Scholar]
- Band, D. L. 1997, ApJ, 486, 928 [NASA ADS] [CrossRef] [Google Scholar]
- Band, D., Matteson, J., Ford, L., et al. 1993, ApJ, 413, 281 [NASA ADS] [CrossRef] [Google Scholar]
- Barniol Duran, R., Bošnjak, Ž., & Kumar, P. 2012, MNRAS, 424, 3192 [NASA ADS] [CrossRef] [Google Scholar]
- Barraud, C., Daigne, F., Mochkovitch, R., & Atteia, J. L. 2005, A&A, 440, 809 [NASA ADS] [CrossRef] [EDP Sciences] [Google Scholar]
- Begelman, M. C., & Li, Z.-Y. 1994, ApJ, 426, 269 [NASA ADS] [CrossRef] [Google Scholar]
- Beloborodov, A. M. 2010, MNRAS, 407, 1033 [NASA ADS] [CrossRef] [Google Scholar]
- Beloborodov, A. M. 2011, ApJ, 737, 68 [NASA ADS] [CrossRef] [Google Scholar]
- Beloborodov, A. M. 2013, ApJ, 764, 157 [NASA ADS] [CrossRef] [Google Scholar]
- Beloborodov, A. M., Hascoet, R., & Vurm, I. 2014, 788, 36 [Google Scholar]
- Beniamini, P., & Piran, T. 2013, ApJ, 769, 69 [NASA ADS] [CrossRef] [Google Scholar]
- Bhat, P. N., Fishman, G. J., Meegan, C. A., et al. 1994, ApJ, 426, 604 [NASA ADS] [CrossRef] [Google Scholar]
- Bhat, P. N., Briggs, M. S., Connaughton, V., et al. 2012, ApJ, 744, 141 [NASA ADS] [CrossRef] [Google Scholar]
- Bissaldi, E., von Kienlin, A., Kouveliotou, C., et al. 2011, ApJ, 733, 97 [NASA ADS] [CrossRef] [Google Scholar]
- Boçi, S., Hafizi, M., & Mochkovitch, R. 2010, A&A, 519, A76 [NASA ADS] [CrossRef] [EDP Sciences] [Google Scholar]
- Borgonovo, L., & Ryde, F. 2001, ApJ, 548, 770 [NASA ADS] [CrossRef] [Google Scholar]
- Bošnjak, Ž., Daigne, F., & Dubus, G. 2009, A&A, 498, 677 [NASA ADS] [CrossRef] [EDP Sciences] [Google Scholar]
- Butler, N. R., & Kocevski, D. 2007, ApJ, 663, 407 [NASA ADS] [CrossRef] [Google Scholar]
- Bykov, A. M., & Meszaros, P. 1996, ApJ, 461, L37 [NASA ADS] [CrossRef] [Google Scholar]
- Bykov, A., Gehrels, N., Krawczynski, H., et al. 2012, Space Sci. Rev., 173, 309 [NASA ADS] [CrossRef] [Google Scholar]
- Cenko, S. B., Frail, D. A., Harrison, F. A., et al. 2010, ApJ, 711, 641 [NASA ADS] [CrossRef] [Google Scholar]
- Crider, A., Liang, E. P., Preece, R. D., et al. 1999, ApJ, 519, 206 [NASA ADS] [CrossRef] [Google Scholar]
- Daigne, F., & Drenkhahn, G. 2002, A&A, 381, 1066 [NASA ADS] [CrossRef] [EDP Sciences] [Google Scholar]
- Daigne, F., & Mochkovitch, R. 1998, MNRAS, 296, 275 [NASA ADS] [CrossRef] [Google Scholar]
- Daigne, F., & Mochkovitch, R. 2000, A&A, 358, 1157 [NASA ADS] [Google Scholar]
- Daigne, F., & Mochkovitch, R. 2002, MNRAS, 336, 1271 [NASA ADS] [CrossRef] [Google Scholar]
- Daigne, F., & Mochkovitch, R. 2003, MNRAS, 342, 587 [NASA ADS] [CrossRef] [Google Scholar]
- Daigne, F., Bošnjak, Ž., & Dubus, G. 2011, A&A, 526, A110 [NASA ADS] [CrossRef] [EDP Sciences] [Google Scholar]
- Derishev, E. V. 2007, Ap&SS, 309, 157 [NASA ADS] [CrossRef] [Google Scholar]
- Derishev, E. V., Kocharovsky, V. V., & Kocharovsky, V. V. 2001, A&A, 372, 1071 [NASA ADS] [CrossRef] [EDP Sciences] [Google Scholar]
- Dermer, C. D. 2004, ApJ, 614, 284 [NASA ADS] [CrossRef] [Google Scholar]
- Drenkhahn, G., & Spruit, H. C. 2002, A&A, 391, 1141 [NASA ADS] [CrossRef] [EDP Sciences] [Google Scholar]
- Fenimore, E. E., in ’t Zand, J. J. M., Norris, J. P., Bonnell, J. T., & Nemiroff, R. J. 1995, ApJ, 448, L101 [NASA ADS] [CrossRef] [Google Scholar]
- Fenimore, E. E., Madras, C. D., & Nayakshin, S. 1996, ApJ, 473, 998 [NASA ADS] [CrossRef] [Google Scholar]
- Fishman, G. J., & Meegan, C. A. 1995, ARA&A, 33, 415 [NASA ADS] [CrossRef] [Google Scholar]
- Foley, S. 2012, in Gamma-Ray Bursts 2012 Conference (GRB 2012) [Google Scholar]
- Foley, S., Bhat, P. N., Gruber, D., et al. 2011, in AIP Conf. Ser. 1358, eds. J. E. McEnery, J. L. Racusin, & N. Gehrels, 183 [Google Scholar]
- Ford, L. A., Band, D. L., Matteson, J. L., et al. 1995, ApJ, 439, 307 [NASA ADS] [CrossRef] [Google Scholar]
- Gao, W.-H., Mao, J., Xu, D., & Fan, Y.-Z. 2009, ApJ, 706, L33 [NASA ADS] [CrossRef] [Google Scholar]
- Gehrels, N., & Razzaque, S. 2013, Frontiers of Physics [Google Scholar]
- Gehrels, N., Chincarini, G., Giommi, P., et al. 2004, ApJ, 611, 1005 [NASA ADS] [CrossRef] [Google Scholar]
- Genet, F., & Granot, J. 2009, MNRAS, 399, 1328 [NASA ADS] [CrossRef] [Google Scholar]
- Ghirlanda, G., Ghisellini, G., & Celotti, A. 2004, A&A, 422, L55 [NASA ADS] [CrossRef] [EDP Sciences] [Google Scholar]
- Ghisellini, G., Ghirlanda, G., Nava, L., & Celotti, A. 2010, MNRAS, 403, 926 [NASA ADS] [CrossRef] [Google Scholar]
- Giannios, D., & Spitkovsky, A. 2009, MNRAS, 400, 330 [NASA ADS] [CrossRef] [Google Scholar]
- Giannios, D., & Spruit, H. C. 2005, A&A, 430, 1 [NASA ADS] [CrossRef] [EDP Sciences] [Google Scholar]
- Giannios, D., & Spruit, H. C. 2007, A&A, 469, 1 [NASA ADS] [CrossRef] [EDP Sciences] [Google Scholar]
- Giannios, D., Mimica, P., & Aloy, M. A. 2008, A&A, 478, 747 [NASA ADS] [CrossRef] [EDP Sciences] [Google Scholar]
- Goldstein, A., Burgess, J. M., Preece, R. D., et al. 2012, ApJS, 199, 19 [NASA ADS] [CrossRef] [Google Scholar]
- Golenetskii, S. V., Mazets, E. P., Aptekar, R. L., & Ilinskii, V. N. 1983, Nature, 306, 451 [NASA ADS] [CrossRef] [Google Scholar]
- Goodman, J. 1986, ApJ, 308, L47 [NASA ADS] [CrossRef] [Google Scholar]
- Granot, J., Komissarov, S. S., & Spitkovsky, A. 2011, MNRAS, 411, 1323 [Google Scholar]
- Guidorzi, C., Lacapra, M., Frontera, F., et al. 2011, A&A, 526, A49 [NASA ADS] [CrossRef] [EDP Sciences] [Google Scholar]
- Guiriec, S., Briggs, M. S., Connaugthon, V., et al. 2010, ApJ, 725, 225 [NASA ADS] [CrossRef] [Google Scholar]
- Guiriec, S., Connaughton, V., Briggs, M. S., et al. 2011, ApJ, 727, L33 [NASA ADS] [CrossRef] [Google Scholar]
- Guiriec, S., Daigne, F., Hascoët, R., et al. 2013, ApJ, 770, 32 [NASA ADS] [CrossRef] [Google Scholar]
- Hafizi, M., & Mochkovitch, R. 2007, A&A, 465, 67 [NASA ADS] [CrossRef] [EDP Sciences] [Google Scholar]
- Hakkila, J., & Preece, R. D. 2011, ApJ, 740, 104 [NASA ADS] [CrossRef] [Google Scholar]
- Hakkila, J., Giblin, T. W., Norris, J. P., Fragile, P. C., & Bonnell, J. T. 2008, ApJ, 677, L81 [NASA ADS] [CrossRef] [Google Scholar]
- Hascoët, R., Daigne, F., & Mochkovitch, R. 2012, A&A, 542, L29 [NASA ADS] [CrossRef] [EDP Sciences] [Google Scholar]
- Hascoët, R., Daigne, F., & Mochkovitch, R. 2013, A&A, 551, A124 [NASA ADS] [CrossRef] [EDP Sciences] [Google Scholar]
- Kaneko, Y., Preece, R. D., Briggs, M. S., et al. 2006, ApJS, 166, 298 [NASA ADS] [CrossRef] [Google Scholar]
- Kargatis, V. E., Liang, E. P., Hurley, K. C., et al. 1994, ApJ, 422, 260 [NASA ADS] [CrossRef] [Google Scholar]
- Kargatis, V. E., Liang, E. P., & BATSE Team. 1995, Ap&SS, 231, 177 [NASA ADS] [CrossRef] [Google Scholar]
- Keshet, U., Katz, B., Spitkovsky, A., & Waxman, E. 2009, ApJ, 693, L127 [NASA ADS] [CrossRef] [Google Scholar]
- Kobayashi, S., Piran, T., & Sari, R. 1997, ApJ, 490, 92 [NASA ADS] [CrossRef] [Google Scholar]
- Komissarov, S. S., Vlahakis, N., Königl, A., & Barkov, M. V. 2009, MNRAS, 394, 1182 [NASA ADS] [CrossRef] [Google Scholar]
- Komissarov, S. S., Vlahakis, N., & Königl, A. 2010, MNRAS, 407, 17 [NASA ADS] [CrossRef] [Google Scholar]
- Kouveliotou, C., Meegan, C. A., Fishman, G. J., et al. 1993, ApJ, 413, L101 [NASA ADS] [CrossRef] [Google Scholar]
- Krimm, H. A., Yamaoka, K., Sugita, S., et al. 2009, ApJ, 704, 1405 [NASA ADS] [CrossRef] [Google Scholar]
- Kumar, P., & Barniol Duran, R. 2009, MNRAS, 400, L75 [NASA ADS] [CrossRef] [Google Scholar]
- Kumar, P., & Barniol Duran, R. 2010, MNRAS, 409, 226 [NASA ADS] [CrossRef] [Google Scholar]
- Kumar, P., & Panaitescu, A. 2000, ApJ, 541, L51 [NASA ADS] [CrossRef] [Google Scholar]
- Kumar, P., Hernández, R. A., Bošnjak, Ž., & Duran, R. B. 2012, MNRAS, 427, L40 [NASA ADS] [Google Scholar]
- Lamb, D. Q., Ricker, G. R., Atteia, J.-L., et al. 2004, New A Rev., 48, 423 [Google Scholar]
- Lazzati, D., Morsony, B. J., Margutti, R., & Begelman, M. C. 2013, ApJ, 765, 103 [NASA ADS] [CrossRef] [Google Scholar]
- Lemoine, M. 2013, MNRAS, 428, 845 [NASA ADS] [CrossRef] [Google Scholar]
- Liang, E. P. 1997, ApJ, 491, L15 [NASA ADS] [CrossRef] [Google Scholar]
- Liang, E., & Kargatis, V. 1996, Nature, 381, 49 [NASA ADS] [CrossRef] [Google Scholar]
- Liang, E. W., Zhang, B., O’Brien, P. T., et al. 2006, ApJ, 646, 351 [NASA ADS] [CrossRef] [Google Scholar]
- Lu, R.-J., Wei, J.-J., Liang, E.-W., et al. 2012, ApJ, 756, 112 [NASA ADS] [CrossRef] [Google Scholar]
- Lundman, C., Pe’er, A., & Ryde, F. 2013, MNRAS, 428, 2430 [NASA ADS] [CrossRef] [Google Scholar]
- Lyutikov, M., & Blandford, R. 2003, unpublished [arXiv:astro-ph/0312347] [Google Scholar]
- Martins, S. F., Fonseca, R. A., Silva, L. O., & Mori, W. B. 2009, ApJ, 695, L189 [NASA ADS] [CrossRef] [Google Scholar]
- McBreen, S., Quilligan, F., McBreen, B., Hanlon, L., & Watson, D. 2001, A&A, 380, L31 [NASA ADS] [CrossRef] [EDP Sciences] [Google Scholar]
- McGlynn, S., et al. (Fermi GBM Collaboration.) 2012, in Gamma-Ray Bursts 2012 Conference (GRB 2012) [Google Scholar]
- McKinney, J. C., & Uzdensky, D. A. 2012, MNRAS, 419, 573 [Google Scholar]
- Meegan, C., Lichti, G., Bhat, P. N., et al. 2009, ApJ, 702, 791 [NASA ADS] [CrossRef] [Google Scholar]
- Mészáros, P., & Rees, M. J. 2000, ApJ, 530, 292 [NASA ADS] [CrossRef] [Google Scholar]
- Mimica, P., & Aloy, M. A. 2010, MNRAS, 401, 525 [NASA ADS] [CrossRef] [Google Scholar]
- Mimica, P., & Aloy, M. A. 2012, MNRAS, 421, 2635 [NASA ADS] [CrossRef] [Google Scholar]
- Nakar, E. 2007, Phys. Rep., 442, 166 [NASA ADS] [CrossRef] [Google Scholar]
- Nakar, E., Ando, S., & Sari, R. 2009, ApJ, 703, 675 [NASA ADS] [CrossRef] [Google Scholar]
- Narayan, R., Kumar, P., & Tchekhovskoy, A. 2011, MNRAS, 416, 2193 [NASA ADS] [CrossRef] [Google Scholar]
- Nemiroff, R. J., Norris, J. P., Kouveliotou, C., et al. 1994, ApJ, 423, 432 [NASA ADS] [CrossRef] [Google Scholar]
- Norris, J. P. 2002, ApJ, 579, 386 [NASA ADS] [CrossRef] [Google Scholar]
- Norris, J. P., & Bonnell, J. T. 2006, ApJ, 643, 266 [NASA ADS] [CrossRef] [Google Scholar]
- Norris, J. P., Share, G. H., Messina, D. C., et al. 1986, ApJ, 301, 213 [NASA ADS] [CrossRef] [Google Scholar]
- Norris, J. P., Nemiroff, R. J., Bonnell, J. T., et al. 1996, ApJ, 459, 393 [NASA ADS] [CrossRef] [Google Scholar]
- Norris, J. P., Scargle, J. D., & Bonnell, J. T. 2001, in Gamma-ray Bursts in the Afterglow Era, eds. E. Costa, F. Frontera, & J. Hjorth, 40 [Google Scholar]
- Norris, J. P., Bonnell, J. T., Kazanas, D., et al. 2005, ApJ, 627, 324 [NASA ADS] [CrossRef] [Google Scholar]
- Omodei, N., et al. (Fermi LAT, & Fermi GBM Collaborations) 2009 [arXiv:0907.0715] [Google Scholar]
- Panaitescu, A., & Kumar, P. 2001, ApJ, 554, 667 [NASA ADS] [CrossRef] [Google Scholar]
- Pe’er, A. 2008, ApJ, 682, 463 [NASA ADS] [CrossRef] [Google Scholar]
- Pe’er, A., Mészáros, P., & Rees, M. J. 2006, ApJ, 642, 995 [NASA ADS] [CrossRef] [Google Scholar]
- Piran, T. 1999, Phys. Rep., 314, 575 [NASA ADS] [CrossRef] [Google Scholar]
- Piran, T., Sari, R., & Zou, Y.-C. 2009, MNRAS, 393, 1107 [NASA ADS] [CrossRef] [Google Scholar]
- Qin, Y.-P. 2008, ApJ, 683, 900 [NASA ADS] [CrossRef] [Google Scholar]
- Quilligan, F., McBreen, B., Hanlon, L., et al. 2002, A&A, 385, 377 [NASA ADS] [CrossRef] [EDP Sciences] [Google Scholar]
- Rees, M. J., & Meszaros, P. 1994, ApJ, 430, L93 [NASA ADS] [CrossRef] [Google Scholar]
- Rees, M. J., & Mészáros, P. 2005, ApJ, 628, 847 [NASA ADS] [CrossRef] [Google Scholar]
- Ryde, F., & Svensson, R. 2000, ApJ, 529, L13 [NASA ADS] [CrossRef] [Google Scholar]
- Ryde, F., & Svensson, R. 2002, ApJ, 566, 210 [NASA ADS] [CrossRef] [Google Scholar]
- Ryde, F., Axelsson, M., Zhang, B. B., et al. 2010, ApJ, 709, L172 [NASA ADS] [CrossRef] [Google Scholar]
- Sakamoto, T., Lamb, D. Q., Kawai, N., et al. 2005, ApJ, 629, 311 [NASA ADS] [CrossRef] [Google Scholar]
- Sari, R., Narayan, R., & Piran, T. 1996, ApJ, 473, 204 [NASA ADS] [CrossRef] [Google Scholar]
- Sari, R., Piran, T., & Narayan, R. 1998, ApJ, 497, L17 [NASA ADS] [CrossRef] [Google Scholar]
- Shen, R.-F., Song, L.-M., & Li, Z. 2005, MNRAS, 362, 59 [NASA ADS] [CrossRef] [Google Scholar]
- Shenoy, A., Sonbas, E., Dermer, C., et al. 2013, ApJ, 778, 3 [NASA ADS] [CrossRef] [Google Scholar]
- Sironi, L., & Spitkovsky, A. 2011, ApJ, 726, 75 [NASA ADS] [CrossRef] [Google Scholar]
- Sonbas, E. 2012, in Gamma-Ray Bursts 2012 Conference (GRB 2012) [Google Scholar]
- Spruit, H. C., Daigne, F., & Drenkhahn, G. 2001, A&A, 369, 694 [NASA ADS] [CrossRef] [EDP Sciences] [Google Scholar]
- Stern, B. E., & Poutanen, J. 2004, MNRAS, 352, L35 [NASA ADS] [CrossRef] [Google Scholar]
- Tchekhovskoy, A., Narayan, R., & McKinney, J. C. 2010, New Astron., 15, 749 [Google Scholar]
- Thompson, C. 1994, MNRAS, 270, 480 [NASA ADS] [CrossRef] [Google Scholar]
- Toma, K., Wu, X.-F., & Mészáros, P. 2011, MNRAS, 415, 1663 [NASA ADS] [CrossRef] [Google Scholar]
- Uhm, Z. L., & Zhang, B. 2014, Nat. Phys., 10, 351 [NASA ADS] [CrossRef] [Google Scholar]
- Ukwatta, T. N., Stamatikos, M., Dhuga, K. S., et al. 2010, ApJ, 711, 1073 [NASA ADS] [CrossRef] [Google Scholar]
- Veres, P., & Mészáros, P. 2012, ApJ, 755, 12 [NASA ADS] [CrossRef] [Google Scholar]
- Veres, P., Zhang, B.-B., & Mészáros, P. 2013, ApJ, 764, 94 [NASA ADS] [CrossRef] [Google Scholar]
- Vlahakis, N., & Königl, A. 2003, ApJ, 596, 1080 [NASA ADS] [CrossRef] [Google Scholar]
- Vurm, I., Beloborodov, A. M., & Poutanen, J. 2011, ApJ, 738, 77 [NASA ADS] [CrossRef] [Google Scholar]
- Vurm, I., Lyubarsky, Y., & Piran, T. 2013, ApJ, 764, 143 [NASA ADS] [CrossRef] [Google Scholar]
- Wang, X.-Y., Li, Z., Dai, Z.-G., & Mészáros, P. 2009, ApJ, 698, L98 [NASA ADS] [CrossRef] [Google Scholar]
- Wang, X.-Y., He, H.-N., Li, Z., Wu, X.-F., & Dai, Z.-G. 2010, ApJ, 712, 1232 [NASA ADS] [CrossRef] [Google Scholar]
- Wang, X.-Y., Liu, R.-Y., & Lemoine, M. 2013, ApJ, 771, L33 [NASA ADS] [CrossRef] [Google Scholar]
- Willingale, R., Genet, F., Granot, J., & O’Brien, P. T. 2010, MNRAS, 403, 1296 [NASA ADS] [CrossRef] [Google Scholar]
- Yi, T., Liang, E., Qin, Y., & Lu, R. 2006, MNRAS, 367, 1751 [NASA ADS] [CrossRef] [Google Scholar]
- Zhang, B., & Yan, H. 2011, ApJ, 726, 90 [NASA ADS] [CrossRef] [Google Scholar]
- Zhang, B., & Zhang, B. 2014, ApJ, 782, 92 [CrossRef] [Google Scholar]
- Zhang, B.-B., Liang, E.-W., & Zhang, B. 2007, ApJ, 666, 1002 [NASA ADS] [CrossRef] [Google Scholar]
- Zhang, B.-B., Zhang, B., Liang, E.-W., et al. 2011, ApJ, 730, 141 [NASA ADS] [CrossRef] [Google Scholar]
- Zhang, B., Lu, R.-J., Liang, E.-W., & Wu, X.-F. 2012, ApJ, 758, L34 [NASA ADS] [CrossRef] [Google Scholar]
- Zhao, X., Li, Z., Liu, X., et al. 2014, ApJ, 780, 12 [NASA ADS] [CrossRef] [Google Scholar]
All Tables
All Figures
|
Fig. 1 Three reference cases: normalized light curves in the four BATSE channels (blue line: 20−50 keV; black line: 50−100 keV; green line: 100−300 keV; red line: 300−2000 keV) for the cases A, B, and C (see text). |
| In the text | |
|
Fig. 2 Three reference cases: spectral evolution. The time evolution of the observed peak energy Ep,obs (top) and low-energy photon index α (bottom) is plotted for the three reference cases: A (black), B (red), and C (blue). In the top panel, the energy range of the four BATSE channels is also indicated. |
| In the text | |
|
Fig. 3 Three reference cases: dependence of the pulse shape on energy. Top: pulse width as a function of energy. Bottom: position of the pulse maximum in channel i with respect to the lowest considered energy band, 20−50 keV (BATSE channel 1). Dashed lines show the energy bands for which the light curves were calculated. The first 4 energy bands correspond to the same 4 BATSE channels as used in Fig. 1. The shaded regions indicate the spectral coverage of Fermi GBM and LAT detectors. Black dots correspond to reference case A, red crosses to case B, and blue square symbols to case C. |
| In the text | |
|
Fig. 4 Three reference case: hardness-intensity and hardness-fluence correlations. The peak energy energy is plotted as a function of the photon flux (left panel) and photon fluence (right panel) between 20 keV and 2 MeV for the three reference cases, A (black), B (red), and C (blue). The peak energy, photon flux, and photon fluence are normalized by their respective maximum values. The dashed lines show the behaviour during the rise of the pulse, thick lines correspond to the decay phase, and the thin lines are the high-latitude emission. This last stage is unlikely to be observed in complex light curves, except during the early steep decay in X-rays. |
| In the text | |
|
Fig. 5 Impact of the electron slope p: spectral evolution. The time evolution of the observed peak energy Ep,obs (top) and low-energy photon index α (bottom) in case B is plotted for different values of the relativistic electron slope p. The evolution for p = 3.3 and p = 3.9 has also been computed but is not shown because the curves coincide with the case p = 2.9. In each case, the value of ζ is adjusted to keep the same observed peak energy of the time-integrated spectrum (see Table 1). |
| In the text | |
|
Fig. 6 Impact of the electron slope p: hardness-intensity correlation. The HIC diagram in Case B is plotted for different values of the relativistic electron slope p. |
| In the text | |
|
Fig. 7 Impact of the electron slope p: pulse width and time lags. Same as in Fig. 3 for Case B with four different values of the electron slope p. Colour code is the same as in Fig. 5. In the lower panel, the time lags are the same for the four cases except for the highest energy channel where the p = 2.3 and p = 2.5 cases show an important lag, whereas the p = 2.7 and p = 2.9 cases do not show any lag. |
| In the text | |
|
Fig. 8 Impact of a varying accelerated electron fraction ζ: spectral evolution. Time-resolved spectra are plotted for Case B assuming a varying parameter ζ during the propagation of internal shocks (see text). The corresponding light curves are shown in the right panel of Fig. 10. Each curve corresponds to a time interval of 0.25 s, starting with the bluest curve (0.5–0.75 s) and finishing with the reddest one (9.75–10 s). The time bin corresponding to the pulse maximum is indicated (1.5–1.75 s). The time-integrated spectrum is also plotted as a thick black line. A thin dashed line of photon index α = − 1 is indicated for comparison. |
| In the text | |
|
Fig. 9 Impact of a varying accelerated electron fraction ζ: hardness-intensity correlation. Same as in Fig. 4 for Case B with a varying parameter ζ during the propagation of internal shocks (see text), either with the same ejection duration as in the reference Case B (black) or with an extended high-Lorentz factor tail in the ejecta (red): see Sect. 5.1. |
| In the text | |
|
Fig. 10 Impact of a varying accelerated electron fraction ζ: pulse shape. Same as in Fig. 1 for Cases A (left panel) and B (right panel) assuming a varying parameter ζ during the propagation of internal shocks (see text). Conventions are the same as in Fig. 1. The corresponding time-evolving spectrum for Case B is shown in Fig. 8. |
| In the text | |
|
Fig. 11 Impact of a varying accelerated electron fraction ζ: spectral evolution – pulse width and time lags. Curves are plotted for Case B with a varying parameter ζ during internal shocks (see text), either with the same ejection duration as in the reference Case B (black) or with an extended high-Lorentz factor tail in the ejecta (red): see Sect. 5.1. For the first case (black, 2 s duration for the ejection), the corresponding spectra and light curves are plotted in Fig. 8 and in the right panel of Fig. 10. Left panel: the time evolution of the peak energy and the low-energy photon index. The dashed vertical line indicates the start of the high-latitude emission. Right panel: evolution of the pulse width and time lags, as in Fig. 3. |
| In the text | |
|
Fig. 12 Evolution of the physical conditions in the shocked region. Left panel: the evolution of the Lorentz factor Γ∗ (top), the specific energy density ϵ∗ (middle), and the mass density ρ∗ (bottom) is plotted for the reference Case B (Case A would show exactly the same evolution), Case B with a sharp distribution of the initial Lorentz factor (see text) and Case B with a constant ejected mass flux Ṁ rather than a constant injected kinetic power Ė (see text). For each case, two curves are seen, corresponding to the propagation of “forward” and “reverse” internal shocks. Middle panel: corresponding spectral evolution (same colour code) assuming a constant fraction ζ of accelerated electrons. Right panel: corresponding spectral evolution (same colour code) assuming a varying fraction ζ of accelerated electrons (see text). |
| In the text | |
|
Fig. 13 Impact of the initial distribution of the Lorentz factor in the outflow. Left and middle panels: normalized light curves corresponding to the 4 BATSE energy channels for Case B computed with the sharp initial distribution of the Lorentz factor given by Eq. (10) and a constant (left) or varying (middle) accelerated electron fraction (see text). Conventions are the same as in Fig. 1. Right panel: pulse width and pulse maximum position as a function of energy for the same cases (filled circles: constant ζ, open circles: varying ζ). The shaded regions and lines have the same meaning as in Fig. 3. |
| In the text | |
|
Fig. 14 Impact of the shape of the injected kinetic power in the outflow. Left and middle panels: normalized light curves corresponding to the 4 BATSE energy channels for Case B computed by assuming a constant ejected mass flux Ṁ rather than a constant injected kinetic power Ė (see text) and a constant (left) or varying (middle) accelerated electron fraction (see text). Conventions are the same as in Fig. 1. Right panel: pulse width and pulse maximum position as a function of energy for the same cases (filled circles: constant ζ; open circles: varying ζ). The shaded regions and lines have the same meaning as in Fig. 3. |
| In the text | |
|
Fig. 15 Effect of the duration of the ejection. The peak energy at the maximum of the pulse (top panel), the difference between the time of maximum in BATSE channel 3 and 1 (second panel), the index of the power law giving the evolution of the pulse width with energy a = − dlnW/ dlnE (third panel), the ratio of the rise and decay time of the pulse in BATSE channel 2+3 (fourth panel), and the hardness ratio H32 (ratio of the photon fluence in BATSE channel 3 over the photon fluence in BATSE channel 2) are plotted as a function of the duration T90 in BATSE channel 2+3 for Case A with a constant (blue) or varying (cyan) ζ , and Case B with a constant (red) or varying (magenta) ζ, with p = 2.7 in all cases. The other model parameters are constant and equal the values given in Table 1, except for the duration of the ejection tw, which is varied from 2 ms to 200 s. |
| In the text | |
|
Fig. 16 High-energy emission: spectra. The time-integrated spectrum (0–15 s) is plotted from the keV to the GeV range for the same cases as in Fig. 18. Top left panel: reference Cases A and B. Bottom left panel: Cases A and B with a varying accelerated electron fraction ζ. Top right panel: Case B with a sharp initial distribution of the Lorentz factor (see text) and a constant or a varying accelerated electron fraction ζ. Bottom right panel: Case B with a constant ejected mass flux (see text) and a constant or a varying accelerated electron fraction ζ. |
| In the text | |
|
Fig. 17 High-energy emission: effect of the electron slope p. The time-integrated spectrum (0–15 s) is plotted from the keV to the GeV range for reference Cases A (left panels) and B (right panels), either assuming a constant (top panels) or a varying (bottom panels) fraction ζ of accelerated electrons, with p = 2.5 (black) or 2.7 (blue). |
| In the text | |
|
Fig. 18 High-energy emission: light curves. The light curves in the soft gamma-ray range (260 keV–5 MeV, left figure) and in the high-energy gamma-ray range (>1 GeV, right figure) are plotted for different cases discussed in the paper. For the high-energy light curves, a thin solid line indicates that the synchrotron emission is dominant above 1 GeV whereas a thick solid line indicates that the inverse-Compton emission is dominant. Top panel: reference Cases A and B; Second panel: Cases A and B with a varying accelerated electron fraction ζ; Third panel: Case B with a sharp initial distribution of the Lorentz factor (see text) and a constant or a varying accelerated electron fraction ζ; Bottom panel: Case B with a constant ejected mass flux (see text) and a constant or a varying accelerated electron fraction ζ. |
| In the text | |
Current usage metrics show cumulative count of Article Views (full-text article views including HTML views, PDF and ePub downloads, according to the available data) and Abstracts Views on Vision4Press platform.
Data correspond to usage on the plateform after 2015. The current usage metrics is available 48-96 hours after online publication and is updated daily on week days.
Initial download of the metrics may take a while.