Fig. 7
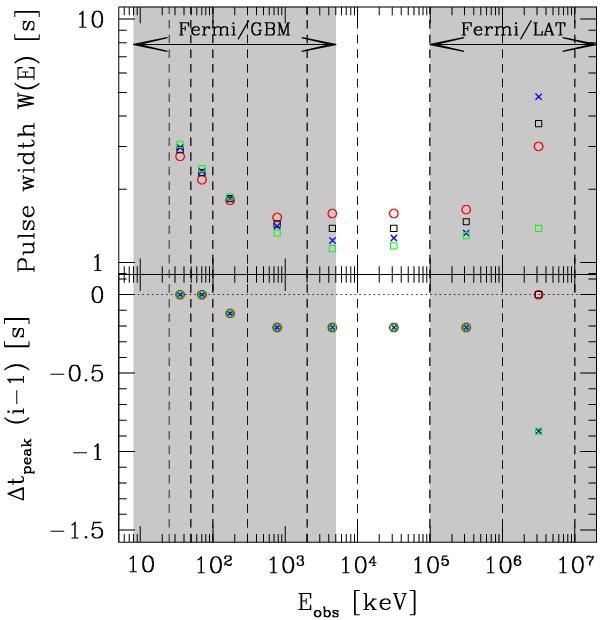
Impact of the electron slope p: pulse width and time lags. Same as in Fig. 3 for Case B with four different values of the electron slope p. Colour code is the same as in Fig. 5. In the lower panel, the time lags are the same for the four cases except for the highest energy channel where the p = 2.3 and p = 2.5 cases show an important lag, whereas the p = 2.7 and p = 2.9 cases do not show any lag.
Current usage metrics show cumulative count of Article Views (full-text article views including HTML views, PDF and ePub downloads, according to the available data) and Abstracts Views on Vision4Press platform.
Data correspond to usage on the plateform after 2015. The current usage metrics is available 48-96 hours after online publication and is updated daily on week days.
Initial download of the metrics may take a while.