Fig. 3
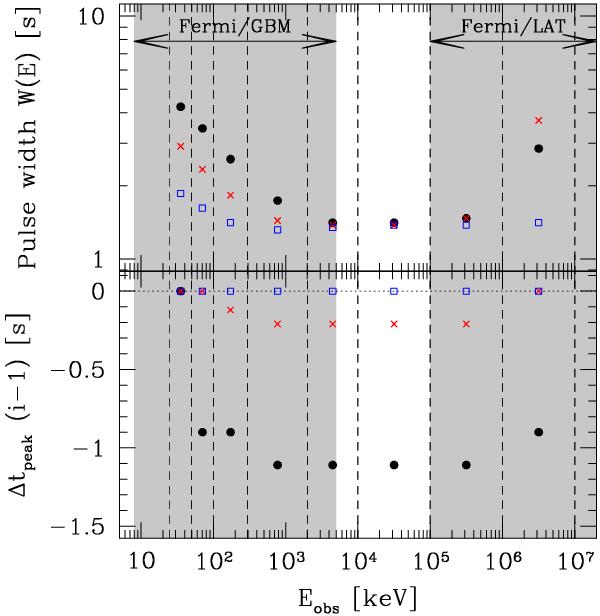
Three reference cases: dependence of the pulse shape on energy. Top: pulse width as a function of energy. Bottom: position of the pulse maximum in channel i with respect to the lowest considered energy band, 20−50 keV (BATSE channel 1). Dashed lines show the energy bands for which the light curves were calculated. The first 4 energy bands correspond to the same 4 BATSE channels as used in Fig. 1. The shaded regions indicate the spectral coverage of Fermi GBM and LAT detectors. Black dots correspond to reference case A, red crosses to case B, and blue square symbols to case C.
Current usage metrics show cumulative count of Article Views (full-text article views including HTML views, PDF and ePub downloads, according to the available data) and Abstracts Views on Vision4Press platform.
Data correspond to usage on the plateform after 2015. The current usage metrics is available 48-96 hours after online publication and is updated daily on week days.
Initial download of the metrics may take a while.