Free Access
Fig. 2
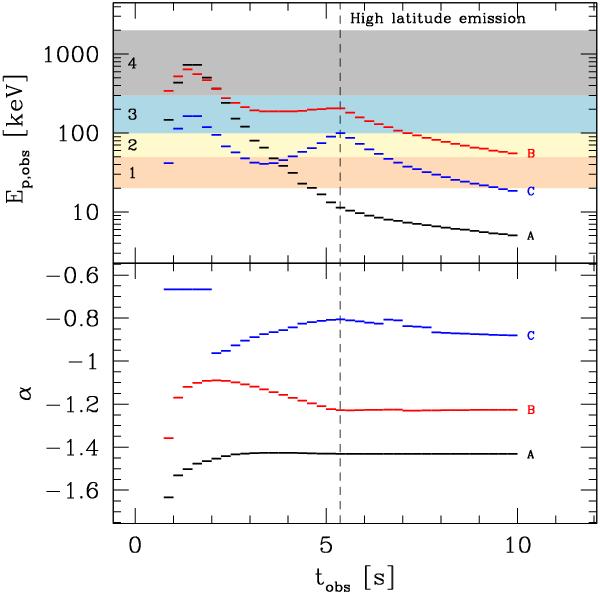
Three reference cases: spectral evolution. The time evolution of the observed peak energy Ep,obs (top) and low-energy photon index α (bottom) is plotted for the three reference cases: A (black), B (red), and C (blue). In the top panel, the energy range of the four BATSE channels is also indicated.
Current usage metrics show cumulative count of Article Views (full-text article views including HTML views, PDF and ePub downloads, according to the available data) and Abstracts Views on Vision4Press platform.
Data correspond to usage on the plateform after 2015. The current usage metrics is available 48-96 hours after online publication and is updated daily on week days.
Initial download of the metrics may take a while.