Fig. 18
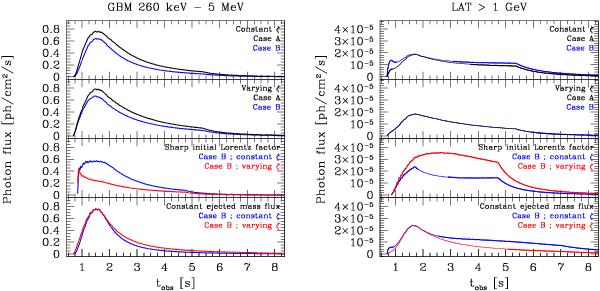
High-energy emission: light curves. The light curves in the soft gamma-ray range (260 keV–5 MeV, left figure) and in the high-energy gamma-ray range (>1 GeV, right figure) are plotted for different cases discussed in the paper. For the high-energy light curves, a thin solid line indicates that the synchrotron emission is dominant above 1 GeV whereas a thick solid line indicates that the inverse-Compton emission is dominant. Top panel: reference Cases A and B; Second panel: Cases A and B with a varying accelerated electron fraction ζ; Third panel: Case B with a sharp initial distribution of the Lorentz factor (see text) and a constant or a varying accelerated electron fraction ζ; Bottom panel: Case B with a constant ejected mass flux (see text) and a constant or a varying accelerated electron fraction ζ.
Current usage metrics show cumulative count of Article Views (full-text article views including HTML views, PDF and ePub downloads, according to the available data) and Abstracts Views on Vision4Press platform.
Data correspond to usage on the plateform after 2015. The current usage metrics is available 48-96 hours after online publication and is updated daily on week days.
Initial download of the metrics may take a while.