Fig. 16
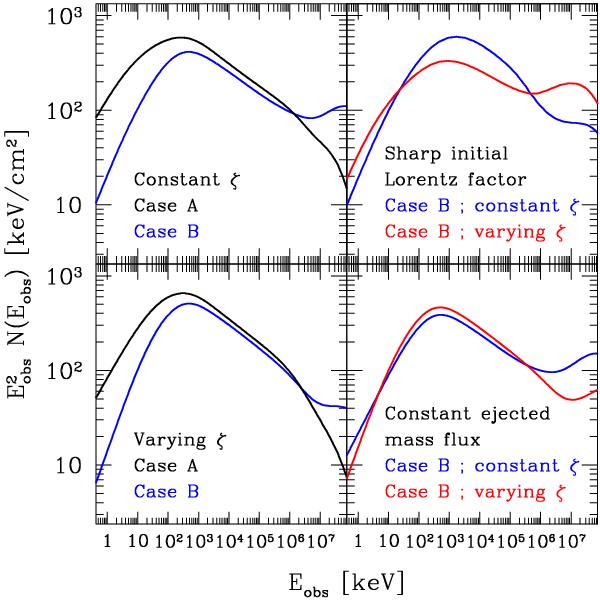
High-energy emission: spectra. The time-integrated spectrum (0–15 s) is plotted from the keV to the GeV range for the same cases as in Fig. 18. Top left panel: reference Cases A and B. Bottom left panel: Cases A and B with a varying accelerated electron fraction ζ. Top right panel: Case B with a sharp initial distribution of the Lorentz factor (see text) and a constant or a varying accelerated electron fraction ζ. Bottom right panel: Case B with a constant ejected mass flux (see text) and a constant or a varying accelerated electron fraction ζ.
Current usage metrics show cumulative count of Article Views (full-text article views including HTML views, PDF and ePub downloads, according to the available data) and Abstracts Views on Vision4Press platform.
Data correspond to usage on the plateform after 2015. The current usage metrics is available 48-96 hours after online publication and is updated daily on week days.
Initial download of the metrics may take a while.