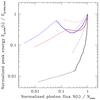
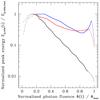
Fig. 4

Three reference case: hardness-intensity and hardness-fluence correlations. The peak energy energy is plotted as a function of the photon flux (left panel) and photon fluence (right panel) between 20 keV and 2 MeV for the three reference cases, A (black), B (red), and C (blue). The peak energy, photon flux, and photon fluence are normalized by their respective maximum values. The dashed lines show the behaviour during the rise of the pulse, thick lines correspond to the decay phase, and the thin lines are the high-latitude emission. This last stage is unlikely to be observed in complex light curves, except during the early steep decay in X-rays.
Current usage metrics show cumulative count of Article Views (full-text article views including HTML views, PDF and ePub downloads, according to the available data) and Abstracts Views on Vision4Press platform.
Data correspond to usage on the plateform after 2015. The current usage metrics is available 48-96 hours after online publication and is updated daily on week days.
Initial download of the metrics may take a while.