Fig. 12
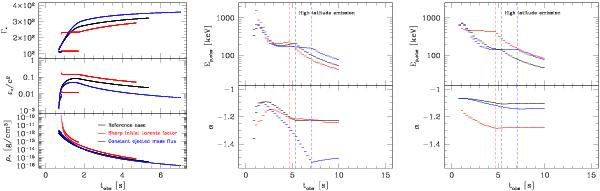
Evolution of the physical conditions in the shocked region. Left panel: the evolution of the Lorentz factor Γ∗ (top), the specific energy density ϵ∗ (middle), and the mass density ρ∗ (bottom) is plotted for the reference Case B (Case A would show exactly the same evolution), Case B with a sharp distribution of the initial Lorentz factor (see text) and Case B with a constant ejected mass flux Ṁ rather than a constant injected kinetic power Ė (see text). For each case, two curves are seen, corresponding to the propagation of “forward” and “reverse” internal shocks. Middle panel: corresponding spectral evolution (same colour code) assuming a constant fraction ζ of accelerated electrons. Right panel: corresponding spectral evolution (same colour code) assuming a varying fraction ζ of accelerated electrons (see text).
Current usage metrics show cumulative count of Article Views (full-text article views including HTML views, PDF and ePub downloads, according to the available data) and Abstracts Views on Vision4Press platform.
Data correspond to usage on the plateform after 2015. The current usage metrics is available 48-96 hours after online publication and is updated daily on week days.
Initial download of the metrics may take a while.