| Issue |
A&A
Volume 539, March 2012
|
|
|---|---|---|
| Article Number | A29 | |
| Number of page(s) | 25 | |
| Section | Interstellar and circumstellar matter | |
| DOI | https://doi.org/10.1051/0004-6361/201117268 | |
| Published online | 22 February 2012 | |
Surviving the hole
I. Spatially resolved chemistry around Sagittarius A∗⋆
1
European Southern Observatory, Alonso de Córdova 3107, Vitacura, Casilla 19001,
Santiago 19,
Chile
e-mail: This email address is being protected from spambots. You need JavaScript enabled to view it.
2
Harvard-Smithsonian Center for Astrophysics,
60 Garden St., 02138, Cambridge, MA,
USA
3
Centro de Astrobiología (CSIC-INTA), Ctra. de Torrejón Ajalvir, km 4, 28850
Torrejón de Ardoz, Madrid,
Spain
4
Department of Astronomy, Columbia University,
550 West 120th Street,
New York, NY
10027,
USA
5
Institute of Astronomy and Astrophysics, Academia Sinica,
PO Box 23141,
Taipei
106,
Taiwan
Received:
17
May
2011
Accepted:
1
December
2011
Abstract
Context. The interstellar region within the few central parsecs around the super-massive black hole, Sgr A∗, at the very Galactic center is composed of a number of overlapping molecular structures that are subject to one of the most hostile physical environments in the Galaxy.
Aims. Through the study of the morphology and kinematics of the emission from different molecular species as well as the variation of their line ratios we can attain a deeper understanding of the distribution and interaction between different gas structures and the energetic phenomena taking place in the surroundings of Sgr A∗ and of the physical processes responsible for the heating in this region.
Methods. We performed high-resolution (4″ × 3″ ~ 0.16 × 0.11 pc) interferometric observations of CN, 13CN, H2CO, SiO, c-C3H2 and HC3N emission at 1.3 mm toward the central ~4 pc of the Galactic center region.
Results. Strong differences are observed in the distribution of the different molecules. The UV resistant species CN, the only species tracing all previously identified circumnuclear disk (CND) structures, is mostly concentrated in optically thick clumps in the rotating filaments around Sgr A∗. H2CO emission traces a shell-like structure that we interpret as the expansion of Sgr A East against the 50 km s-1 and 20 km s-1 giant molecular clouds (GMCs). We derive isotopic ratios 12C/13C ~ 15−45 across most of the CND region, except for the northeast arm, where the peak of H2CO is observed and ratios <10 are found. The densest molecular material, traced by SiO and HC3N, is located in the southern CND, likely because of shocked gas infalling from the 20 km s-1 GMC streamers, and the northeast arm, as a result of the expansion of Sgr A East or a connecting point of the 50 km s-1 streamer east of the CND. The observed c-C3H2/HC3N ratio observed in the region is more than an order of magnitude lower than in Galactic PDRs. Toward the central region only CN was detected in absorption. In addition to the known narrow line-of-sight absorptions, a 90 km s-1 wide optically thick spectral feature is observed. We found evidence of an even wider (>100 km s-1) absorption feature. About 70−75% of the gas mass, concentrated in just the 27% densest molecular clumps, is associated with rotating structures and show evidence of an association with each of the arcs of ionized gas in the mini-spiral structure.
Conclusions. These observations provide a combined chemical and kinematical picture of the very central region around Sgr A∗. Chemical differentiation has been proven to be a powerful tool to distinguish the many overlapping molecular components in this crowded and heavily obscured region.
Key words: ISM: molecules / ISM: clouds / radio lines: ISM / Galaxy: center / ISM: kinematics and dynamics
Figures 12–22 and Tables 3 and 4 are available in electronic form at http://www.aanda.org
© ESO, 2012
1. Introduction
At a distance of ~8.0 kpc (Reid 1993; Groenewegen et al. 2008; Ghez et al. 2008) the few central parsecs around the super-massive black hole at the dynamic center of the Galaxy (4.1 ± 0.6 × 10⁶ M⊙, Ghez et al. 2008) are likely one of the most hostile environments for the interstellar medium (ISM) in the Milky Way. In this region the molecular gas undergoes strong disruptive tidal forces and pervasive X-ray irradiation (LX(20−120 keV) ~ 2.6 × 1035 erg s-1; Bélanger et al. 2006) in the vicinity of the black hole. Likewise, the ISM is subject to supernova remnants (SNR), HII regions, and strong photodissociating UV fields from the central cluster (L ~ 1−3 × 10⁷ L⊙ and ionizing photon flux of 2 × 1050 s-1; Lacy et al. 1980; Davidson et al. 1992).
The super-massive black hole is associated with the compact strong non thermal source Sgr A∗. The mini-spiral of ionized gas consisting of three streamers known as Sgr A West (Lo & Claussen 1983; Ekers et al. 1983) is likely feeding the central source. Surrounding Sgr A West, the so-called circumnuclear disk (CND) is a clumpy ringlike structure rotating counterclockwise around the dynamical center (Guesten et al. 1987; Wright et al. 2001; Christopher et al. 2005). The molecular ring extends from its inner sharp edge at a projected distance of 1.6 pc from Sgr A∗, out to a smoother edge at ~2 pc (Christopher et al. 2005). However, the CND appears not to be a single symmetric structure forming a coherent ring (Marshall et al. 1995). It has been suggested that the CND is a warped structure (Guesten et al. 1987) or, because of the incompleteness of the ring, formed by distinct rotating structures (Jackson et al. 1993; Wright et al. 2001). Most of the observed molecular clumps forming the CND, with diameters of ~7″, are tidally stable and in virial equilibrium (Christopher et al. 2005). Thus, the rotating molecular structures composing the CND appear to be non transient structures with an estimated lifetime of ~107 yr (Christopher et al. 2005; Montero-Castaño et al. 2009).
A number of molecular emission observations have been carried out to study the CND structure, its relation to the Sgr A West streamers, and the possible interaction with the two giant molecular clouds (GMC), namely the 20 km s-1 and 50 km s-1 GMCs (see Ho et al. 1991; Marr et al. 1993; Montero-Castaño et al. 2009, for references). So far, the only species with high-resolution aperture synthesis observations are the HCN 1−0 (Guesten et al. 1987; Wright et al. 2001; Christopher et al. 2005), 3−2 (Marshall et al. 1995), and 4−3 (Marshall et al. 1995; Montero-Castaño et al. 2009), the 1−0 transitions of H13CN and HCO+ (Marr et al. 1993; Wright et al. 2001; Christopher et al. 2005), the CS 7−6 (Montero-Castaño et al. 2009), and NH3 (1, 1), (2, 2), (3, 3), (6, 6) (McGary et al. 2001; Herrnstein & Ho 2005). The emission from the high-density tracers like HCN, HCO+, and CN nicely trace all molecular features of the CND, though significant differences are observed in the line ratios. These differences are attributed to both abundance and density variations across the CND (e.g. HCO+/HCN, Christopher et al. 2005). Although also tracing the CND, the emission of NH3 significantly differs from the emission of the other tracers. The recent work at low resolution by Amo-Baladrón et al. (2011) studies, among other tracers, the emission of SiO and HNCO in the central 12 pc around Sgr A∗. These species show strong abundance variations caused by the influence of shocks and UV radiation in this region (Martín et al. 2008). They probe the potential of HNCO/SiO abundance ratio as a measurement of the distance to the central cluster, which provides an insight in the 3-D arrangement of the different molecular components.
In this paper we report the high-resolution (4″ × 3″ ~ 0.16 × 0.11 pc) observations of CN, 13CN, H2CO, SiO, c-C3H2, and HC3N. As illustrated by the three-color composite image shown in Fig. 1, each molecular species traces different molecular components as a result of the varying physical and chemical conditions in the vicinity of Sgr A∗.
2. Observations
Observations were carried out with the Submillimeter Array1 (SMA, Ho et al. 2004) in Mauna Kea, Hawaii. We tuned the 230 GHz receivers to observe two spectral windows centered at the frequencies of 217.41 GHz (LSB) and 227.38 GHz (USB). Correlator configuration provided 2 × 1.968 GHz wide bands at a 0.8125 MHz spectral resolution.
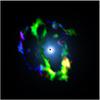 |
Fig. 1 Three-color composite image of the CND around Sgr A∗ including the emission of SiO (red), CN (green), H2CO (blue). The central glow shows an artistic representation of the pervasive X-ray and UV-fields from the black hole and central star cluster. In the center, the black hole position is illustrated with a size corresponding to the map resolution. |
Observational details of each frequency setup.
A total of three SMA observing tracks were acquired in its compact and subcompact configurations. Specific observing and calibration details on each of the three SMA tracks are summarized in Table 1. Weather conditions were good (PWV ~ 3 mm) during compact observations and only mediocre (PWV ~ 4−5 mm) during the subcompact. However, phase was observed to be stable in all three tracks.
The observations in the subcompact configuration data were the key to recover the extended emission from the CND structure. This flux recovery is perfectly illustrated by comparing the observations of HCN 4−3 with just the compact configuration data reported by Montero-Castaño et al. (2006) and the final data set including the subcompact configuration data (Montero-Castaño et al. 2009). The combination of both configurations resulted in projected baselines between 8 m (6 kλ) and 135 m (90 kλ), which is equivalent to structure sizes between 34″ and 2″, respectively. Nevertheless, the final cleaned images show negative flux areas nearby the brightest emission regions, which are indicative of the significant missing extended (>30″) emission.
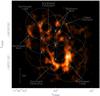 |
Fig. 2 Central position and primary beam of each of the 9-field mosaic observations. Background image is the HCN 4−3 emission by Montero-Castaño et al. (2009). The different molecular structures labels are adopted from Christopher et al. (2005) and Montero-Castaño et al. (2009). |
We observed a 9-pointing mosaic centered at αJ2000 = 17h45m40s, δJ2000 = −29°00′28′′ and arranged with a 26″ spacing and a declination offset between each 3-point column of 13″ as shown in Fig. 2. This mosaic configuration was aimed to fully sample the elongated CND structure and all features identified in the high-resolution maps of HCN 4−3 by Montero-Castaño et al. (2009). The observation was performed in short 4-min integrations on each of the mosaic pointings with 3-min integrations on the gain calibrators every ~20 min. The combination of the three tracks resulted in a total integration time per pointing of ~84 min.
Continuum subtraction was performed in the UV plane using the available line-free channels between all identified molecular features. Data calibration and reduction were performed using the MIR-IDL package, while we used MIRIAD (Sault et al. 1995) for cleaning and GILDAS2 for data display and analysis. The natural weighting of the visibilities resulted in a beam size of 4.1″ × 2.9″ with a position angle of ~30°. The theoretical rms noise for individual pointings (assuming no overlapping) was ~40 mJy beam-1 in 10 km s-1 channels. The final achieved rms noise was ~31 and 34 mJy beam-1 for the LSB and USB, respectively, as measured in the central 40″ region in line free channels.
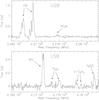 |
Fig. 3 Sample spectra extracted from a 4″ size square region at the position 1 indicated in Fig. 4. The spectra of both USB and LSB are shown with the identified spectral transitions labeled. |
3. Results
Within the total ~4 GHz frequency band observed, we have detected the emission of six molecular species. Figure 3 shows the sample spectra extracted from the resulting data cubes at the position of the brightest molecular emission (position 1 in Fig. 4) where the entire identified spectral features are labeled. Basic spectroscopic details for each molecular transition are given in Table 2. Additionally, the emission of HC3N J = 24−23 emission at 218.3 GHz is detected close to the H2CO transition. However, this line is truncated at the lower velocities and therefore was not included in this work.
Spectral parameters of the transitions detected.
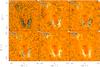 |
Fig. 4 Natural weighted integrated intensity maps of all detected species in this work. Beam size of 4.1″ × 2.9″ is shown in the lower left corner of each box. Emission was integrated over the velocity range between −140 and +140 km s-1 for SiO, C3H2, and HC3N, while we used the velocity ranges of [−190, +470] for CN, [−80, +140] for H2CO, and [−190, +350] for 13CN (see Sect. 3 for details). Background image corresponds to the integrated emission of CN. Contour levels are at 2σ (with σ = 2.3 Jy beam-1 km s-1) steps for all maps but for CN, where the first contour is 3σ and increases in 8σ steps. |
In Fig. 4 we present the integrated intensity maps from each of the detected transitions. The emission of SiO, C3H2, and HC3N was integrated in the velocity range between −140 km s-1 and +140 km s-1 where emission is detected. We integrated between −190 km s-1 and +470 km s-1 for CN so that the two groups of transitions are included in the image. Similarly, 13CN emission was integrated from −190 km s-1 up to +350 km s-1, where SiO starts showing emission. Finally, H2CO was integrated between −80 km s-1 and +140 km s-1 to avoid the significant emission from HC3N 24−23 (at 218.324 GHz) at the lowest velocities. The narrow features integrated over a relatively wide velocity range caused the integrated maps of the faint c−C3H2 and HC3N to be mostly dominated by noise. Thus, we included channel maps of integrated emission over 30 km s-1 bins for each species in Figs. 12 to 17 (online) where the origin of the fainter emission is clearly identified.
In Fig. 4 we labeled a number of selected positions corresponding to the molecular cores identified in the integrated maps. We extracted the spectra from each of these positions and performed a multiple velocity component Gaussian fit. The resulting parameters from these fits are shown in Table 3 (online) for CN and 13CN and in Table 4 (online) for the rest of species.
4. Spatially resolved chemistry
The differences in the distribution of the emission of each of the detected species are shown in the integrated maps in Fig. 4. Strong differences are also evident in velocity, as shown in the channel maps in Figs. 12–17 (online). Below we describe the main morphological structures observed for each individual species. The origin of each species is discussed in terms of chemical differentiation and excitation. To study the chemical differentiation in detail, we show line ratio maps in 30 km s-1 velocity bins in Figs. 18–22 (online).
The labeling of the different CND molecular structures, shown in Fig. 2, are adopted from Christopher et al. (2005) and Montero-Castaño et al. (2009).
4.1. CN: overall molecular emission
Out of the six molecular species observed, CN is the only one tracing all previously identified CND features. Though differences are observed, the integrated emission of CN appears to be mostly coexisting and tracing the same molecular material as that observed in HCN and CS (Christopher et al. 2005; Montero-Castaño et al. 2009). In Fig. 5 we present a comparison between the HCN 4−3 integrated emission from Montero-Castaño et al. (2009) and that of CN 2−1. Most of the main formation paths of CN in gas phase involve HCN, either by direct photodissociation of HCN into CN, charge exchange with CN+, ion-neutral reactions with HCN+ and C2H+ or by dissociative recombination of HCN+ (Woodall et al. 2007). These processes are expected to be efficient because of the enhancement of ion species by the radiation, which pervades the environment surrounding the central cluster. Moreover, as shown in Fig. 6, CN is the most UV resistant species among those presented in this paper, with photodissociation rates for moderate shielding similar to those of HCN and CS. Indeed, CS formation is also known to be favored in UV radiated regions via the enhancement of its main precursor S+ (Goicoechea et al. 2006, and references therein), which may explain why the three species show a similar spatial distribution in this region.
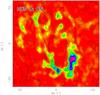 |
Fig. 5 Comparison between the HCN 4−3 integrated emission (color; Montero-Castaño et al. 2009) and the CN integrated emission (contours). Contour levels start at 3σ and increases in 10σ steps. |
We can, however, point out a number of significant differences between the HCN and CS emission and that of the CN maps. The emission in the southwest lobe and southern extensions agree well in extension and location of the emission peaks of CN and HCN. Even though CN 2−1 and HCN 1−0 transitions share similar excitation conditions, the southern extension observed in CN extends toward the north, connecting with the northern extension. This is observed in the 4−3 transition of HCN as well as in CS 7−6 (Montero-Castaño et al. 2009), but not in HCN 1−0 (Christopher et al. 2005). Therefore, this is not an effect of self-absorption of the HCN 1−0 in this extension toward the north but rather filtering of the extended emission in the OVRO maps by Christopher et al. (2005). The northeast extension and lobe appear connected in the CN map, similar to that observed in HCN 1−0. This connection is not observed in the 4−3 emission, likely because of a higher excitation in the southern part of the northeast extension as shown by the HCN 4−3/1−0 ratio in Fig. 8 from Montero-Castaño et al. (2009). The CN emission in the northeast arm is significantly less prominent than that observed in HCN, which might indicate a real abundance deficiency in this elongated feature. As discussed below (Sect. 4.2), this structure is prominent in H2CO and matches the emission structure traced by HCN.
Based on the HCN 4−3 data of Montero-Castaño et al. (2009), at a similar resolution as the CN 2−1 data, we derived some rough estimates of the HCN/CN ratio of ~3−2 in the southern CND down to a slightly lower ratio of ~2−1 in the northeast lobe. The ratios were estimated by comparing the integrated intensity maps and confirmed by the comparison of the peak intensities of the spectra in selected positions shown in Fig. 4 from Montero-Castaño et al. (2009). These differences could be explained by the different excitation conditions along the CND region (Fig. 8 in Montero-Castaño et al. 2009).
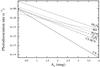 |
Fig. 6 Photodissociation rate as a function of the visual extinction for each of the species discussed. Rates are extracted from UMIST database (Woodall et al. 2007) and assume the standard ISM UV field (Draine 1978). |
4.2. H2CO: expanding shell
Figure 4 shows how the integrated intensity of H2CO differs drastically from that of CN. Even though H2CO emission is detected toward the positions of peak CN emission (see Table 4 online), most of the emission of this molecule is detected in the outer regions of the CND. The emission of H2CO appears to trace a shell-like structure roughly centered at an offset position of ~(+12″, +10″) from Sgr A∗ with a radius of ~37″. These differences are particularly evident in the channel maps in Fig. 13 (online). For the velocities below 0 km s-1, where significant high-velocity emission from HC3N 24−23 is detected in the northeast arm, the H2CO emission follows the brightest regions observed in CN. At these velocities, CN/H2CO line ratios range from 3−4 in the southwest lobe and in its connection to the southern extension (position 37 in Fig. 4) up to >30 in the regions where H2CO is not detected. However, the distribution of the emission differs for positive velocities. Channel maps centered at 0 and 30 km s-1 show emission mostly toward the south, while channel maps centered at 30 and 60 km s-1 show strong emission in the easternmost region of the maps. In these velocity channels the H2CO emission is observed to be extended over regions where CN is not detected, where line ratio limits CN/H2CO < 0.2 are found. This is particularly prominent for the emission in the 0 and 30 km s-1 centered channels, where strong H2CO emission is observed east of the southern extension.
The H2CO molecule is efficiently formed in dust grains (Watanabe & Kouchi 2002; Watanabe et al. 2004; Cuppen et al. 2009) where photo-induced chemistry by UV radiation can lead to the production of H2CO from the H2O and CO in solid phase (Shalabiea & Greenberg 1994). Thus, the abundance of H2CO in the gas-phase can be enhanced owing to grain erosion by shocks and/or thermal evaporation in the vicinity of hot young stars (Shalabiea & Greenberg 1994), while the main destruction paths are via photodissociation and reactions with C+ (Federman & Allen 1991; Turner 1993). Indeed, after HC3N, the H2CO molecule is the most sensitive to photodissociation in our sample, which explains why, apart from the shell-like structure, H2CO is only detected closer to Sgr A∗ toward the brightest CN regions. In these dense regions the molecular gas is more shielded from photodissociation.
The observed circular structure could be interpreted as the interaction of Sgr A East mostly with the 50 km s-1 and 20 km s-1 giant molecular clouds, east and south of the CND, respectively. The kinematics of H2CO also support this scenario as seen in the channel maps. Taking the Gaussian fits in Table 4 (online), the brightest observed H2CO molecular components have velocities of 30−60 km s-1 toward the northern half of the CND with its maximum toward the northeast, and velocities of ~10 km s-1 toward the southern regions. These velocities are consistent with the emission of H2CO being associated with an expanding shell impacting the 50 km s-1 GMC in the north and northeast of the CND, and the 20 km s-1 GMC in the southern region. In these regions, H2CO abundance would be enhanced in the gas-phase by the expansion of Sgr A East into the surrounding GMCs, where it will survive in moderately dense molecular clumps (Av > 2, Shalabiea & Greenberg 1994, and Fig. 6), shielded from the pervading UV radiation from the central cluster. The compression by an expanding shell is supported by the enhanced emission of HC3N and SiO in this structure (Sects. 4.3 and 4.6).
Chemical differentiation of the eastern region is also suggested by the lower 12C/13C ratio measured in this region as compared to the central CND structure (see Sect. 4.4).
4.3. SiO: infalling shocked material
With a critical density of ~108 cm-3, the 5−4 transition of SiO is tracing the densest molecular material in the CND. The single-dish maps of the SiO 2−1 (Amo-Baladrón et al. 2011) show the SiO emission to be extended and tracing the whole CND structure. Similarly, the interferometric map of SiO 2−1 by Sato & Tsuboi (2009) clearly shows emission along the CND. However, our map of the 5−4 transition emission is observed to be more compact as expected because of the different excitation conditions between both transitions. Indeed, the one order of magnitude larger critical density of the 5−4 transition compared to that of the 2−1 makes it unlikely that the emission is spread over large scales (see Sect. 2), and therefore filtered out in our maps.
SiO 5−4 emission is mostly found toward the southern region of the CND, in the southwest and southern extension, and the northeast arm. We find CN/SiO line ratios ranging between 1−5 in the southern region and of ~8−10 in the northeast. Similar to H2CO, lower limits of >30 are found in the regions with no SiO detection. SiO is also observed in the northeast arm and east of the southern extension, where prominent H2CO emission was found, with limits to the CN/SiO < 0.3 in the regions with no CN detection.
The SiO molecule is not efficiently formed in the cold gas phase if Si is not released to gas phase. Therefore, its emission is commonly accepted to be a tracer of the presence of shocks that are responsible for SiO ejection from grain mantles (Ziurys et al. 1989; Martin-Pintado et al. 1992). Indeed, SiO is widely spread across the Galactic center region likely because of large-scale shocks that affect the giant molecular clouds (Martin-Pintado et al. 1997). Though SiO has been found to be correlated with the 6.4 keV Fe line, which points to an X-ray induced enhancement of SiO (Martín-Pintado et al. 2000; Amo-Baladrón et al. 2009), the lack of prominent 6.4 keV line emission in the CND region (Yusef-Zadeh et al. 2007) and the compact emission of SiO makes it unlikely that X-ray is the main driver of the high SiO abundance. Though UV photodesorption has been proposed as a possible driver of the SiO enhancement (Schilke et al. 2001), one would expect its distribution to be more uniform within the central CND, similar to CN and HCN, and not so prominent in the northeast arm. Moreover, although it was claimed that shock velocities >40 km s-1 are needed to destroy the silicate grains (Seab & Shull 1983), recent observations and modeling have shown low-velocity C-shocks (v = 5−10 km s-1) to efficiently sputter the silicon from grain mantles (Jiménez-Serra et al. 2005, 2008). Consequently, the enhancement of SiO toward the southern region could be understood by shock destruction of dust grains in the cloud complexes (Amo-Baladrón et al. 2011). From this material, the 5−4 transition is tracing the densest molecular material affected by shocks. These shocks could originate in gas inflow into the CND.
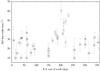 |
Fig. 7 SiO line width as a function of the position angle on the sky east of north as measured from Sgr A∗. Numbers correspond to Fig. 4 labels. Position 14 and one of the velocity components in position 9 are not shown because of the large uncertainty in the width measurement. The positions with the larger widths at PA around 200° correspond to the southern lobe and southern extension of the CND structure. |
Coil & Ho (1999) found kinematic evidence of gas streamers from the southern 20 km s-1 molecular cloud into the CND. The main gas flow, known as the southern streamer, would be connecting to the southern extension and could currently be feeding this molecular structure. Moreover, Coil & Ho (1999) propose the presence of two streamers emerging from the 20 km s-1 cloud. The second streamer would originate in the northwest of the 20 km s-1 cloud and would connect the CND toward the southwest lobe. The SiO 2−1 map by Sato & Tsuboi (2009) shows emission from two filaments south of the CND, which supports the idea of the two streamers. The presence of these streamers connecting the 20 km s-1 cloud with the CND would explain the two separated molecular complexes observed in the southern CND and the enhancement of SiO emission through shocked material in the interaction between the streamers and the southern structures. This gas infall might be the cause for the wider line widths observed toward the southern lobe. Figure 7 shows the measured line widths on each of the molecular components studied, where we observed the line widths to vary between 10 and 30 km s-1 in most positions except for those in the southern regions of the CND, where line widths systematically exceed 30 km s-1, up to values of 60 km s-1. This increase in the linewidth is consistent with the one observed in NH3 as the gas approaches the CND from the 20 km s-1 GMC (Coil & Ho 1999). We note how the SiO emission, although it follows the kinematics of CN (see Sect. 6), is observed to be at the outer edge of the southwest lobe as seen in the −120 to −90 km s-1 channel maps (Fig. 19 online), while the SiO enhanced gas is merged with the gas traced by CN in the −30 and 0 km s-1 channel maps. Similarly, the SiO emission in the southern extension is observed toward the southern edge of the structure. Toward the northeast lobe we also observe an enhancement of the SiO emission right at the center of this structure, which could be linked to the 50 km s-1 streamer from the nearby GMC (Jackson et al. 1993). Though SiO enhancement is observed at the positions where the inflowing streamers are claimed to connect to the CND, to fully confirm the inflowing origin of the SiO emission, we need large-scale sensitive mapping, such as the one carried out towards the southern part of the CND by Sato & Tsuboi (2009).
Additionally, we observe SiO emission in the northeast arm and east of the southern extension closely following the emission observed in H2CO (see Sect. 4.2). Silicon sputtering is expected at these positions in the scenario of Sgr A East expanding against the 50 km s-1 and 20 km s-1 GMCs.
We emphasize that the line widths of SiO at all measured positions do not show significant differences, within the measurement errors, with the line widths of the other species. Moreover, we did not find traces of shock-induced differences in the line profiles, such as line wings. Even if the velocity resolution of our maps is not sufficient to detect asymmetries caused by low-velocity C-shocks, we can discard high-velocity shocks as the main origin of the SiO abundance. Thus, SiO is likely enhanced by cloud-cloud collisions as the material approaches the CND.
4.4. 13CN: carbon 12C/13C isotopic ratio
The simultaneous observation of 12CN and 13CN provides a direct measurement of the 12C/13C isotopic ratio in the inner region of the Galaxy. Additionally, the fit of the hyperfine molecular components to the observed profiles allows us to estimate the opacity of the CN emission along the CND. Table 3 (online) shows the results of the fit to the CN and 13CN observed profiles in a number of selected positions labeled in Fig. 4. The opacity of the brightest component of the CN hyperfine group, derived from the observed line profiles, is also tabulated in Table 3 (online). We find that CN is optically thick (τ ≳ 1) throughout most of the CND structure. We calculated the integrated intensity ratio CN/13CN in all positions where 13CN was detected.
From our estimate of the opacity of CN, we calculated the opacity-corrected CN/13CN as a proxy to the 12C/13C isotopic ratio. As shown by comparing the last two columns in Table 3 (online) and given that only the brightest hyperfine transitions within the observed CN spectral features are severely affected by opacity, the integrated intensity ratio CN/13CN appears to provide a reasonably good estimate of the carbon isotopic ratio. We measured 12C/13C ratios in the wide range of 15−45. This result agrees with the values reported toward the Sgr A region (Audouze et al. 1975; Wannier 1980) and is consistent with the scenario of 13C enrichment toward the Galactic center region (Wilson & Rood 1994; Wilson 1999).
Only a few positions are observed to have significantly low isotopic ratios <10. However, these positions are either particular velocity components that may not be related to the CND structure, or the eastern-most molecular component in our maps where the H2CO is most prominent. This difference in the isotopic ratio seems to support the H2CO molecular complex to be not only morphologically (Sect. 4.2), but chemically detached from the central CND structure. However, there are too few positions with measurements of this ratio to be able to draw firm conclusions based on the different carbon isotopic ratios.
4.5. c-C3H2
Two spectral features of the carbon chain c-C3H2 are detected. The one shown in Fig. 4, which is a combination of the 61,6−50,5 and 60,6−51,5 transitions, and a second feature centered at 217.940 GHz corresponding to the 51,4−42,3 transition. However, this feature is ~2 times fainter and is mostly undetected in our maps. This feature appears at the lowest velocities in the channel maps in Fig. 16 (online). Even at the positions where both features are detected, it is not possible to make a reliable estimate of the excitation temperature because of the limited dynamic range in the energies involved in these transitions.
The emission of c-C3H2 is faint in the CND. It is barely visible in the integrated map (Fig. 4), but integrated channel maps (Fig. 16 online) show c-C3H2 to follow HC3N. We note, however, that we found some selected positions where c-C3H2 is detected, but no trace of HC3N (see Table 4 online).
It has been claimed that c-C3H2 is mainly formed in gas phase by
dissociative recombination of c-C3H (Gerin
et al. 2011) and that it is much less sensitive to photodissociation than
HC3N. This molecule has been observed to be very abundant in diffuse clouds
(Lucas & Liszt 2000) and in photodissociation
regions (PDRs, Teyssier et al. 2004). Moreover, in
their study of different PDRs, Teyssier et al.
(2004) found the emission c-C3H2 and other small
hydrocarbons up to the edge of the PDR. On the chemical basis we would then expect the
emission of c-C3H2 to be more prominent over the entire CND region.
In the Horsehead nebula, a column density ratio of
c-C3H2/HC3N ~ 25 ± 12 is found in the position
where both species are detected. Across the CND, we find integrated line ratios of
c-C3H2/HC3N = 0.4−2.4. Owing to the considerable upper
level energy difference between the transitions observed for c-C3H2
and HC3N, the column density ratio strongly depends on the excitation
temperature. We assumed a range of likely temperatures of 20−50 K, corresponding to the
dust temperature components fitted by Etxaluze et al.
(2011). We found column density ratios of 0.8−5 × 10⁻² and 0.3−1.6 for
a temperature of 20 and 50 K, respectively. Thus, independent of the temperature
assumption, abundance ratios in the CND differ significantly from those of PDR such as the
Horsehead nebula. However, it is unclear whether this is caused by an underabundance of
c-C3H2 or by the enhanced emission of HC3N in the CND
region. Observations of the light carbon chain CCH, intimately related to
c-C3H2 (Teyssier et al.
2004; Gerin et al. 2011), might be a
better candidate to study the distribution of the carbon chains in the vicinity of
Sgr A∗.
(Gerin
et al. 2011) and that it is much less sensitive to photodissociation than
HC3N. This molecule has been observed to be very abundant in diffuse clouds
(Lucas & Liszt 2000) and in photodissociation
regions (PDRs, Teyssier et al. 2004). Moreover, in
their study of different PDRs, Teyssier et al.
(2004) found the emission c-C3H2 and other small
hydrocarbons up to the edge of the PDR. On the chemical basis we would then expect the
emission of c-C3H2 to be more prominent over the entire CND region.
In the Horsehead nebula, a column density ratio of
c-C3H2/HC3N ~ 25 ± 12 is found in the position
where both species are detected. Across the CND, we find integrated line ratios of
c-C3H2/HC3N = 0.4−2.4. Owing to the considerable upper
level energy difference between the transitions observed for c-C3H2
and HC3N, the column density ratio strongly depends on the excitation
temperature. We assumed a range of likely temperatures of 20−50 K, corresponding to the
dust temperature components fitted by Etxaluze et al.
(2011). We found column density ratios of 0.8−5 × 10⁻² and 0.3−1.6 for
a temperature of 20 and 50 K, respectively. Thus, independent of the temperature
assumption, abundance ratios in the CND differ significantly from those of PDR such as the
Horsehead nebula. However, it is unclear whether this is caused by an underabundance of
c-C3H2 or by the enhanced emission of HC3N in the CND
region. Observations of the light carbon chain CCH, intimately related to
c-C3H2 (Teyssier et al.
2004; Gerin et al. 2011), might be a
better candidate to study the distribution of the carbon chains in the vicinity of
Sgr A∗.
4.6. HC3N: the warm dense molecular component
Similar to SiO 5−4, the HC3N 25−24 transition is likely tracing the densest molecular component with a critical density of ~2 × 106 cm-3 (Wernli et al. 2007). Indeed, the emission of these two species appears to be coexisting and reaching its maximum emission toward the southern region of the CND (in the southwest lobe and the southern extension) and the northeast arm. Both species show the highest enhancement relative to CN in the northeast arm. We observed CN/HC3N ratios of ~5−6 in the southern structures down to ratios of ~2 in the northeast arm.
However, the formation and destruction of HC3N differs from that of SiO. HC3N is efficiently formed in the gas phase by neutral-neutral reactions involving CN and C2H2, which can be abundant in an UV irradiated environment (Meier & Turner 2005, and references therein). Additionally, HC3N is the species with the highest photodissociation rate (Fig. 6) and is efficiently destroyed with reactions with C+. Therefore, in the heavily irradiated CND region, the formation reaction of HC3N will overcome the photodestruction rate only within moderately shielded clouds (Av > 1−2 Woodall et al. 2007).
Consequently, the high-J transition of HC3N with an upper level energy of ~150 K is tracing the warmest dense molecular clumps, shielded from the photodissociation radiation from Sgr A∗. In the southwest lobe and extension the HC3N is observed in the outer edge of the CN emitting region, where the UV radiation is attenuated. HC3N shows its brightest emission in the southern part of the northeast arm, where it shows the lowest ratio SiO/HC3N < 1. However, though SiO also traces the dense gas material, the formation of HC3N via CN explains that no HC3N emission is observed in regions where CN is absent, as seen in the SiO maps.
5. The spectra toward Sgr A∗
The low-J transitions of HCN show absorption spectral features toward the position of Sgr A∗ (Guesten et al. 1987; Wright et al. 2001; Christopher et al. 2005). In Fig. 8 we show the CN absorption spectra toward the Sgr A∗ position.
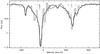 |
Fig. 8 Continuum-subtracted CN 2−1 spectra extracted from a 4″ box around the Sgr A∗ position. The thick black line represents the fit performed to the line profile where three velocity components have been considered. Two narrow (~20 km s-1) absorption features are fitted at −157 and −23 km s-1 and a ~100 km s-1 wide feature at −32 km s-1. The thin gray line shows the individual contribution of the narrow −23 km s-1 component and the wide component at −32 km s-1. Vertical lines show the position and relative intensities of each individual CN hyperfine structure transition. The intensities and positions of these lines correspond to the fit results to the wider component. |
We fitted a 3-component hyperfine group profile to the observed spectrum. In Fig. 8 we indicate the relative position and intensities of the CN hyperfine components and the fit results. The two narrow features at −157 km s-1 and −23 km s-1, with widths of 16 and 20 km s-1, respectively, have been previously identified as absorptions from galactic spiral arms along the line of sight at −135, −50 and −30 km s-1 (see Wright et al. 2001). Our −23 km s-1 feature is likely a composite of the extended local gas at 0 km s-1 (Guesten et al. 1987) and the −50 and −30 km s-1 galactic arms. The opacities derived from the fit for the main hyperfine transition are ~0.1 and 0.9 for the −157 km s-1 and −23 km s-1 components, respectively. Both narrow features are relatively optically thin.
On top of these narrow features we fitted a 94 km s-1 wide component centered at −32 km s-1. Different from the narrow features, the opacity of the main hyperfine transition is τCN ~ 3. This is likely the material closer to Sgr A∗, observed in absorption in the line of sight to the non-thermal central source emission from the low-J of the transition. Down to zero level the absorption extends from ~−150 km s-1 to ~100 km s-1, wider than the absorption observed from HCN or HCO+ (Christopher et al. 2005). Moreover, the residual absorption in the velocity range around –200 and 100 km s-1 might suggest an even wider (>100 km s-1) absorption component.
The absorption spectrum toward the central compact sources is particularly interesting for studying the chemistry of the molecular gas in its line of sight. However, regarding the other molecular species presented in this paper, none is detected either in absorption or emission toward the Sgr A∗ position. This absence reflects abundance deficiencies of these species toward the galactic arms and also in the inner molecular gas around Sgr A∗. The intense UV radiation from the central cluster is likely responsible for the photodissociation of most molecular species in the very central region.
6. CND clump kinematics
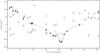 |
Fig. 9 Velocities of each of the CN molecular components fitted at each of the core positions labeled in Fig. 4 as a function of the position angle on the sky east of north as measured from Sgr A∗. Each marker is labeled with the corresponding position where the velocity was measured. The different symbols represent different groups of cores/components: southern CND (filled circles), northern CND (filled squares), 70 km s-1 sources (open squares), 50 km s-1 sources (open triangles), 0 km s-1 sources (stars), and negative velocities sources (open circles). The overlaid lines represent rotating ring models fitted to the core velocities in the southwest lobe (solid line), southern extension (dashed line), and northeast lobe (dotted line). See Sect. 6 for details on the sources and models represented. |
In this section we aim to analyze the kinematics of all molecular emission peaks selected and labeled in Fig. 4 including all velocity components fitted to each individual CN spectrum as compiled in Table 3 (online). We selected CN for this study because it is the only species that shows emission in all selected positions. A total of 66 velocity components were identified and fitted towards the 38 selected molecular clumps (where we do not include the central Sgr A∗ position).
Figure 9 shows the measured velocities as a function of the position angle (PA) east of north as measured from the position of Sgr A∗. Similar plots have been presented by Guesten et al. (1987) and Jackson et al. (1993), who plotted the velocity centroids along the CND. However, we here include the individual velocity components at each selected position so that we can separate the different molecular clumps in velocity space in the line of sight. At each position we find molecular velocity components related to the different CND rotating structures as well as kinematically detached from it. Only 29% of all velocity components are associated with rotating structures around Sgr A∗ (see Sect. 6.1), while the remaining ~70% belong to the overlapping GMCs or likely foreground material along the line of sight. However, these clumps in rotating structures represent 67% in mass of molecular gas. This estimate, based on the percentage of CN integrated intensity in the clumps, turns into a 70%−75% when corrected by the opacity of CN, mostly affecting the clumps associated with the rotating structures (Sect. 4.4).
6.1. CND molecular components
The CND is formed by distinct rotating structures and not a single structure (Jackson et al. 1993; Wright et al. 2001). Our observations seem to prove the presence of three kinematically distinct structures in the CND. We assumed a simple rotating ring model, similar to that used by Guesten et al. (1987), to describe the rotation around Sgr A∗ of each of these structures. Even though these structures are not complete rings, it is a reasonable approximation to describe the rotation in small position angle (PA) ranges.
The southern molecular structure of the CND (filled circles in Fig. 9) cannot be described by a single ring model. This could be observed in the data from Guesten et al. (1987). However, it is possible to fit two different ring models with inclinations of ~80° (solid line) and ~68° (dashed line) for the southwest lobe and the southern extension, respectively. The peak rotation velocity (vrot/sin(i)) for these models were 125 and 86 km s-1, respectively. We observe that the southwest lobe model might extend northward up to position 11, but would not fit position 10 (see Fig. 4). On the other hand, the southern extension model might extend eastward to positions 13 and 12, and toward the west to position 37, which is located in the connecting point between the southern extension and the southwest lobe structures. These results suggest that though close in projection both southern structures do not belong to the same rotating structure, and indeed might be fed by different streamers (see Sect. 4.3).
Similarly, we can fit a ring model to the northeast lobe components (filled squares) with an inclination of ~65° and a peak velocity of 125 km s-1. This structure might start in positions 28 and 29, where H2CO shows a peak of emission, and would continue southward through positions 21 to 23. The northeast extension (position 20, also in filled squares) is not sampled with sufficient points in our study, but it is clearly detached from the kinematics of the northeast lobe.
6.2. Other molecular components
The rest of the molecular components sampled do not seem to be associated with any evident rotating structure but rather with larger-scale structures placed on top of the CND.
We found a number of component at velocities of ~50 km s-1 (open triangles). These positions are located mostly toward the north-east of the maps and are therefore likely related to gas condensations in the 50 km s-1 giant molecular cloud (see SiO and CS single-dish maps by Amo-Baladrón et al. 2011). Mostly toward the north-western parts of the CND we find a molecular component at ~70 km s-1. As observed in the CS maps by Amo-Baladrón et al. (2011), this could be an extension of the 50 km s-1 giant molecular cloud. At velocities of ~0 km s-1 we find a number of components (stars in Fig. 9). These positions are mostly located toward the south-east of our maps and could be associated with the 20 km s-1 GMC and the molecular bridge connecting to the 50 km s-1 GMC. Finally, we observed molecular gas at negative velocities (open circles). Mostly located toward the north-east of the CND, they are likely related to different molecular cloud complexes along the line of sight. However, there is no apparent connection with the CS maps by Amo-Baladrón et al. (2011).
Though the general trends described here for CN apply to all species, some significant differences are found in the velocity component fitted in the other detected species (see Table 4 online). In particular, the emitting region east of the southern extension (Sect. 4.2), where no CN is detected, shows emission peaks at the velocities of ~−9 and 11 km s-1 (position 36 in Table 4 online) consistent with the molecular gas being associated with both foreground clouds and the 20 km s-1 GMC.
7. CND structure and interaction with the mini-spiral
The association of the gas in the CND with the ionized mini-spiral structure has long been discussed (Christopher et al. 2005, and references therein). The inner edge of the CND in the southwest lobe appears to be tightly outlined by the western ionized arc. This correlation has led to the idea that the western arc might be the ionized boundary of the CND where the strong pervasive UV field from the central cluster is responsible for the heating of the CND (Martín et al. 2008; Amo-Baladrón et al. 2011) and the mini-spiral structure (Latvakoski et al. 1999). This association was kinematically confirmed by Christopher et al. (2005). In Fig. 10 we compared our CN observations with the ionized gas traced by the H92α emission from Roberts & Goss (1993). We observe that not only is the emission tracing the inner edge of the southwest lobe, but the H92α appears to trace the inner side facing Sgr A∗ of the CN emitting region. Similarly, the emission peaks of SiO in the southwest lobe are observed in the emission gaps of H92α (lower panel in Fig. 10), as if the ionized gas were tracing the inner boundaries of the SiO emitting gas.
Christopher et al. (2005) noticed a possible connection of the northern arm of the mini-spiral and the northeastern extension of the CND. Our CN observations, in agreement with the HCN 4−3 maps by Montero-Castaño et al. (2009), show a more prominent emission in the northeast extension connecting to a faint but continuous eastern CND molecular emission. Again, the H92α northern arm appears to be tracing the inner edge of the northeast extension of the CND, which might show a similar association as that claimed for the western arc.
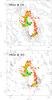 |
Fig. 10 (Upper) Comparison between the H92α integrated emission (color; Roberts & Goss 1993; Zhao et al. 2009) and the CN integrated emission (contours). CN contour levels are the same as in Fig. 5. (Lower) Comparison between the H92α integrated emission (color; Roberts & Goss 1993; Zhao et al. 2009) and the SiO integrated emission (contours). SiO contour levels are the same as in Fig. 4. |
We also observe an anti correlation between the ionized gas and the molecular material. The brightest northern arc outlines the inner edge of the faint molecular gas northeast extension, while the fainter western arc traces the edge of the bright molecular southwest lobe. This could be related to the age of each of the CND structures and the history of molecular fueling from the outer molecular clouds into the CND. In this scenario, the northeast extension would have been mostly ionized in the northern arm and little molecular gas would be left, while the southwest lobe, mostly molecular, would begin to become ionized as it approaches the central region.
The third mini-spiral arc, the eastern arm, has no obvious association with the molecular material. The low-resolution maps of HCN by Marshall et al. (1995) suggested this arc extends northward likely toward the north lobe. Indeed, at the position of ~(25″,30″), the eastern arm traced by H92α emission meets the northeast molecular lobe (upper panel in Fig. 10). Measured velocities from H92α at this position (positions E1 and E2 in Zhao et al. 2009) match those in the northeast molecular lobe (positions 22 and 23 in Fig. 9). Similarly, the eastern ionized arm extends northward as seen in the 6 cm radio maps (Fig. 11, Yusef-Zadeh & Morris 1987). Though this arm appears to be crossing the eastern extension of the CND, there is no evidence of perturbation of the molecular material, which indicates that both features are not in the same plane. Dust emission modeling (Latvakoski et al. 1999) and H92α kinematics (Zhao et al. 2009) showed that the eastern arm must be significantly inclined with respect to the eastern CND.
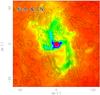 |
Fig. 11 Comparison between the 6 cm continuum emission (color; Yusef-Zadeh & Morris 1987) and the CN integrated emission (contours). CN contour levels are the same as in Fig. 5. Similar to the comparison with H92α in Fig. 10, the association of the northern arm and the western arc with the northern molecular extension and the southwest lobe can be appreciated. The 6 cm shows the clear extension of the eastern arm northward where it meets the bright molecular northeast lobe. |
8. Summary
We presented high-resolution maps of the CN, 13CN, H2CO, SiO, c-C3H2 and HC3N emission toward the central ~4 pc around Sgr A∗. These observations provide a chemical picture of the molecular material in the surroundings of the central super-massive black hole and how the chemically resolved structures relate to the different morphological and kinematical structures. Each of the observed species appears to be tracing different molecular gas structures that are intimately linked to the different heating processes that affect the molecular gas in this region.
Among them, CN is the only species showing emission in all previously described molecular
morphological features in the CND, and it shows a similar distribution to that from
available HCN and CS emission maps (Christopher et al.
2005; Montero-Castaño et al. 2009). Similar
to these two molecules, CN is extremely resistant against the high UV irradiation from the
central cluster. Moreover, its chemistry is linked to that of HCN. These species are shown
to be widespread at the closest distances from Sgr A∗. The emission from
H2CO differs drastically from CN and it is mostly located in the outer regions
of the CND, tracing a ~37″ shell-like structure centered ~16″ away from
Sgr A∗ where H2CO is observed to be even brighter than CN (with
CN/H2CO line ratios below 0.2). Mostly formed in solid phase, H2CO
emission in gas phase can be interpreted as the result of the expansion of Sgr A East
against the 50 km s-1 and 20 km s-1 GMCs east and south of the CND,
respectively. Moreover, the 12C/13C isotopic ratio, estimated from the
12CN/13CN, supports the differentiation of the northeast arm, where
the brightest H2CO emission is observed. While we estimated an opacity corrected
carbon isotopic ratio in the range of 15−45 throughout the CND, consistent with the idea of
13C enrichment with decreasing galactocentric distance owing to nuclear
processing (Wilson & Rood 1994; Wilson 1999), we found the lowest measured ratios
(<10) toward the northeast arm. The opacity derived from the hyperfine fit to the CN
spectral profiles shows that CN is optically thick throughout most of the CND. On the other
hand, the densest (n > 106 cm-3) regions in the
CND are located in the southern CND and the northeast arm as traced by HC3N and
SiO, although their chemical formation paths are different. The southeast lobe and southern
extension, where we find the highest SiO abundance and broader line widths, could be fueled
and shocked by the molecular material from two streamers connecting the 20 km s-1
GMC, where SiO abundance would be enhanced through grain erosion by low-velocity shocks.
Similarly, the bright emission in the northeast lobe could be the consequence of the
inflowing material from the 50 km s-1 streamer connecting the GMC east of the
CND. The similar line widths measured in all species allow us to discard high-velocity
shocks as the origin of SiO. The dense material in the northeast arm could be compressed
because of the expansion of Sgr A East against the 50 km s-1 GMC, where the
brightest HC3N emission as well as significant SiO emission are detected. Even
though HC3N is efficiently formed through reactions involving CN, the emission of
HC3N is deficient close to Sgr A∗ owing to the high
photodissociation rate of this molecule in UV exposed material. The few regions in the inner
CND where HC3N emission is observed will be tracing the densest cores
(Av > 1−2) for this molecule to survive. Finally, the
carbon chain c-C is observed to follow the emission of
HC3N, but with c-C/HC3N at least an order of
magnitude lower than in other Galactic PDRs. It is therefore unclear why the emission of
c-C is so faint in the CND.
is observed to follow the emission of
HC3N, but with c-C/HC3N at least an order of
magnitude lower than in other Galactic PDRs. It is therefore unclear why the emission of
c-C is so faint in the CND.
In the direction of Sgr A∗ only CN is detected in absorption. It shows two previously identified narrow absorptions at −157 and −23 km s-1 from galactic arms along the line of sight. A broad 94 km s-1 line at −32 km s-1 is likely tracing the molecular gas closer to Sgr A∗ absorbing the non-thermal central emission. Moreover, we found hints of a possible wider (>100 km s-1) absorption, which might be tracing the closest molecular material to the central black hole. However, observations of higher energy transitions of UV-resistant species are required to detect this molecular gas component in emission as shown by the HCN 4−3 maps by Montero-Castaño et al. (2009).
We have studied the kinematics of all detected molecular clumps in the CND, where we considered kinematics of each individual velocity component at every selected position. Our study shows that most of these clumps are not associated with any rotating structure around Sgr A∗ but with larger-scale structures overlapping with the CND. However, even if only 29% of the molecular selected components appear clearly associated with rotating structures, they represent 70−75% of the mass of the molecular gas. Only three molecular structures show kinematic evidence of rotation around Sgr A∗. These rotating filaments, namely the southwest lobe, southern extension, and northeast lobe, are rotating in different planes, similar to what is derived from the study of the ionized arcs (Zhao et al. 2009), and are associated with the ionized mini-spiral structure observed in radio continuum and hydrogen recombination lines.
Moreover, we have shown how the various chemically differentiated structures are directly related to the different kinematical structures. In this comparison we observe how CN is mostly concentrated in the dense molecular optically thick clumps rotating (and likely infalling) filaments around Sgr A∗, while the shell-like structure traced by H2CO is not orbiting around the central black hole, but shows velocities related to the overlapping GMCs.
We showed the potential of detailed high-resolution chemical observations to distinguish the complicated molecular structure surrounding Sgr A∗, and to establish the leading heating mechanisms that affect the different molecular structures in the region. Similar to the low-resolution work by Amo-Baladrón et al. (2011), chemical abundances from deep high-resolution imaging of various molecular species as a function of position and distance from Sgr A∗ could potentially be used to establish the three-dimensional distribution of the molecular components in the Galactic center region.
Online material
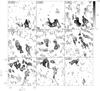 |
Fig. 12 Integrated intensity maps of CN 2−1 in velocity bins of 30 km s-1. Central velocity of each velocity range is displayed in the upper left corner of each panel. First 10 contours are in steps of 3σ, with σ = 0.55 Jy beam-1 km s-1, and subsequently in steps of 6σ. |
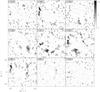 |
Fig. 13 Integrated intensity maps of H2CO 30,3−20,2 in velocity bins of 30 km s-1. Labels and contour steps as in Fig. 12. Note that the observed emission toward the north and east in the −120 and −90 km s-1 maps correspond to the high-velocity emission of HC3N 24−23 (218.324 GHz) detected at the edge of the observed band (Sect. 3). |
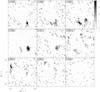 |
Fig. 14 Integrated intensity maps of SiO 5−4 in velocity bins of 30 km s-1. Labels and contour steps as in Fig. 12. |
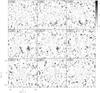 |
Fig. 15 Integrated intensity maps of 13CN 2–1 in velocity bins of 30 km s-1. Labels and contour steps as in Fig. 12. |
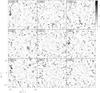 |
Fig. 16 Integrated intensity maps of c-C |
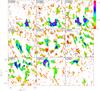 |
Fig. 18 Integrated CN/H2CO line ratio in 30 km s-1 velocity bin maps. Color scale is logarithmic. Ratio has been computed in all pixels where CN emission is detected above 3σ. The contours indicate the regions where H2CO has been detected (>3σ). Therefore, values outside these contours represent lower limits to the line ratio where a constant 3σ value has been assumed as the H2CO upper detection limit. |
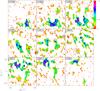 |
Fig. 19 Integrated CN/SiO line ratio in 30 km s-1 velocity bin maps. Ratio has been calculated as in Fig. 18 where the contour enclose the regions where SiO is detected above a >3σ level. |
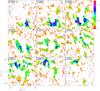 |
Fig. 20 Integrated CN/c-C3H2 line ratio in 30 km s-1 velocity bin maps. Ratio has been calculated as in Fig. 18 where the contour enclose the regions where c-C3H2 is detected above a >3σ level. |
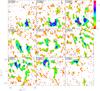 |
Fig. 21 Integrated CN/HC3N line ratio in 30 km s-1 velocity bin maps. Ratio has been calculated as in Fig. 18 where the contour enclose the regions where HC3N is detected above a >3σ level. |
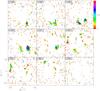 |
Fig. 22 Integrated SiO/HC3N line ratio in 30 km s-1 velocity bin maps. Ratio has been calculated in all pixels where SiO emission is detected above 3σ. Similar to Fig. 18, the contour enclose the regions where HC3N is detected above a >3σ level. |
CN and 13CN Gaussian fit parameters on selected positions.
H2CO, SiO, c-C3H2 and HC3N Gaussian fit parameters on selected positions.
The Submillimeter Array is a joint project between the Smithsonian Astrophysical Observatory and the Academia Sinica Institute of Astronomy and Astrophysics and is funded by the Smithsonian Institution and the Academia Sinica.
Acknowledgments
J.M.-P. and S.M. have been supported MICINN through grants ESP2007-65812-C02-C01 and AYA2010-21697-C05-01, and AstroMadrid (CAM S2009/ESP-1496). The authors would like to thank the referee, whose comments helped to significantly improve the paper.
References
- Amo-Baladrón, M. A., Martín-Pintado, J., Morris, M. R., Muno, M. P., & Rodríguez-Fernández, N. J. 2009, ApJ, 694, 943 [NASA ADS] [CrossRef] [Google Scholar]
- Amo-Baladrón, M. A., Martín-Pintado, J., & Martín, S. 2011, A&A, 526, A54 [NASA ADS] [CrossRef] [EDP Sciences] [Google Scholar]
- Audouze, J., Lequeux, J., & Vigroux, L. 1975, A&A, 43, 71 [NASA ADS] [Google Scholar]
- Bélanger, G., Goldwurm, A., Renaud, M., et al. 2006, ApJ, 636, 275 [Google Scholar]
- Christopher, M. H., Scoville, N. Z., Stolovy, S. R., & Yun, M. S. 2005, ApJ, 622, 346 [NASA ADS] [CrossRef] [Google Scholar]
- Coil, A. L., & Ho, P. T. P. 1999, ApJ, 513, 752 [NASA ADS] [CrossRef] [Google Scholar]
- Cuppen, H. M., van Dishoeck, E. F., Herbst, E., & Tielens, A. G. G. M. 2009, A&A, 508, 275 [NASA ADS] [CrossRef] [EDP Sciences] [Google Scholar]
- Davidson, J. A., Werner, M. W., Wu, X., et al. 1992, ApJ, 387, 189 [NASA ADS] [CrossRef] [Google Scholar]
- Draine, B. T. 1978, ApJS, 36, 595 [NASA ADS] [CrossRef] [Google Scholar]
- Ekers, R. D., van Gorkom, J. H., Schwarz, U. J., & Goss, W. M. 1983, A&A, 122, 143 [NASA ADS] [Google Scholar]
- Etxaluze, M., Smith, H. A., Tolls, V., Stark, A. A., & González-Alfonso, E. 2011, AJ, 142, 134 [Google Scholar]
- Federman, S. R., & Allen, M. 1991, ApJ, 375, 157 [NASA ADS] [CrossRef] [Google Scholar]
- Gerin, M., Kaźmierczak, M., Jastrzebska, M., et al. 2011, A&A, 525, A116 [NASA ADS] [CrossRef] [EDP Sciences] [Google Scholar]
- Ghez, A. M., Salim, S., Weinberg, N. N., et al. 2008, ApJ, 689, 1044 [NASA ADS] [CrossRef] [Google Scholar]
- Goicoechea, J. R., Pety, J., Gerin, M., et al. 2006, A&A, 456, 565 [NASA ADS] [CrossRef] [EDP Sciences] [Google Scholar]
- Groenewegen, M. A. T., Udalski, A., & Bono, G. 2008, A&A, 481, 441 [NASA ADS] [CrossRef] [EDP Sciences] [Google Scholar]
- Guesten, R., Genzel, R., Wright, M. C. H., et al. 1987, ApJ, 318, 124 [NASA ADS] [CrossRef] [Google Scholar]
- Herrnstein, R. M., & Ho, P. T. P. 2005, ApJ, 620, 287 [NASA ADS] [CrossRef] [Google Scholar]
- Ho, P. T. P., Ho, L. C., Szczepanski, J. C., Jackson, J. M., & Armstrong, J. T. 1991, Nature, 350, 309 [NASA ADS] [CrossRef] [Google Scholar]
- Ho, P. T. P., Moran, J. M., & Lo, K. Y. 2004, ApJ, 616, L1 [NASA ADS] [CrossRef] [Google Scholar]
- Jackson, J. M., Geis, N., Genzel, R., et al. 1993, ApJ, 402, 173 [NASA ADS] [CrossRef] [Google Scholar]
- Jiménez-Serra, I., Martín-Pintado, J., Rodríguez-Franco, A., & Martín, S. 2005, ApJ, 627, L121 [NASA ADS] [CrossRef] [Google Scholar]
- Jiménez-Serra, I., Caselli, P., Martín-Pintado, J., & Hartquist, T. W. 2008, A&A, 482, 549 [NASA ADS] [CrossRef] [EDP Sciences] [Google Scholar]
- Lacy, J. H., Townes, C. H., Geballe, T. R., & Hollenbach, D. J. 1980, ApJ, 241, 132 [NASA ADS] [CrossRef] [Google Scholar]
- Latvakoski, H. M., Stacey, G. J., Gull, G. E., & Hayward, T. L. 1999, ApJ, 511, 761 [NASA ADS] [CrossRef] [Google Scholar]
- Lo, K. Y., & Claussen, M. J. 1983, Nature, 306, 647 [NASA ADS] [CrossRef] [Google Scholar]
- Lucas, R., & Liszt, H. S. 2000, A&A, 358, 1069 [NASA ADS] [Google Scholar]
- Marr, J. M., Wright, M. C. H., & Backer, D. C. 1993, ApJ, 411, 667 [NASA ADS] [CrossRef] [Google Scholar]
- Marshall, J., Lasenby, A. N., & Harris, A. I. 1995, MNRAS, 277, 594 [NASA ADS] [Google Scholar]
- Martín, S., Requena-Torres, M. A., Martín-Pintado, J., & Mauersberger, R. 2008, ApJ, 678, 245 [NASA ADS] [CrossRef] [Google Scholar]
- Martin-Pintado, J., Bachiller, R., & Fuente, A. 1992, A&A, 254, 315 [NASA ADS] [Google Scholar]
- Martin-Pintado, J., de Vicente, P., Fuente, A., & Planesas, P. 1997, ApJ, 482, L45 [NASA ADS] [CrossRef] [Google Scholar]
- Martín-Pintado, J., de Vicente, P., Rodríguez-Fernández, N. J., Fuente, A., & Planesas, P. 2000, A&A, 356, L5 [NASA ADS] [Google Scholar]
- McGary, R. S., Coil, A. L., & Ho, P. T. P. 2001, ApJ, 559, 326 [NASA ADS] [CrossRef] [Google Scholar]
- Meier, D. S., & Turner, J. L. 2005, ApJ, 618, 259 [NASA ADS] [CrossRef] [Google Scholar]
- Montero-Castaño, M., Herrnstein, R. M., & Ho, P. T. P. 2006, J. Phys. Conf. Ser., 54, 29 [NASA ADS] [CrossRef] [Google Scholar]
- Montero-Castaño, M., Herrnstein, R. M., & Ho, P. T. P. 2009, ApJ, 695, 1477 [Google Scholar]
- Reid, M. J. 1993, ARA&A, 31, 345 [NASA ADS] [CrossRef] [Google Scholar]
- Roberts, D. A., & Goss, W. M. 1993, ApJS, 86, 133 [NASA ADS] [CrossRef] [Google Scholar]
- Sato, M. T., & Tsuboi, M. 2009, in Approaching Micro-Arcsecond Resolution with VSOP-2: Astrophysics and Technologies, ed. Y. Hagiwara, E. Fomalont, M. Tsuboi, & M. Yasuhiro, ASP Conf. Ser., 402, 388 [Google Scholar]
- Sault, R. J., Teuben, P. J., & Wright, M. C. H. 1995, in Astronomical Data Analysis Software and Systems IV, ed. R. A. Shaw, H. E. Payne, & J. J. E. Hayes, ASP Conf. Ser., 77, 433 [Google Scholar]
- Schilke, P., Pineau des Forêts, G., Walmsley, C. M., & Martín-Pintado, J. 2001, A&A, 372, 291 [NASA ADS] [CrossRef] [EDP Sciences] [Google Scholar]
- Seab, C. G., & Shull, J. M. 1983, ApJ, 275, 652 [NASA ADS] [CrossRef] [Google Scholar]
- Shalabiea, O. M., & Greenberg, J. M. 1994, A&A, 290, 266 [NASA ADS] [Google Scholar]
- Teyssier, D., Fossé, D., Gerin, M., et al. 2004, A&A, 417, 135 [NASA ADS] [CrossRef] [EDP Sciences] [Google Scholar]
- Turner, B. E. 1993, ApJ, 410, 140 [NASA ADS] [CrossRef] [Google Scholar]
- Wannier, P. G. 1980, ARA&A, 18, 399 [NASA ADS] [CrossRef] [Google Scholar]
- Watanabe, N., & Kouchi, A. 2002, ApJ, 571, L173 [NASA ADS] [CrossRef] [Google Scholar]
- Watanabe, N., Nagaoka, A., Shiraki, T., & Kouchi, A. 2004, ApJ, 616, 638 [NASA ADS] [CrossRef] [Google Scholar]
- Wernli, M., Wiesenfeld, L., Faure, A., & Valiron, P. 2007, A&A, 464, 1147 [NASA ADS] [CrossRef] [EDP Sciences] [Google Scholar]
- Wilson, T. L. 1999, Rep. Prog. Phys., 62, 143 [Google Scholar]
- Wilson, T. L., & Rood, R. 1994, ARA&A, 32, 191 [NASA ADS] [CrossRef] [Google Scholar]
- Woodall, J., Agúndez, M., Markwick-Kemper, A. J., & Millar, T. J. 2007, A&A, 466, 1197 [NASA ADS] [CrossRef] [EDP Sciences] [Google Scholar]
- Wright, M. C. H., Coil, A. L., McGary, R. S., Ho, P. T. P., & Harris, A. I. 2001, ApJ, 551, 254 [NASA ADS] [CrossRef] [Google Scholar]
- Yusef-Zadeh, F., & Morris, M. 1987, ApJ, 320, 545 [NASA ADS] [CrossRef] [Google Scholar]
- Yusef-Zadeh, F., Muno, M., Wardle, M., & Lis, D. C. 2007, ApJ, 656, 847 [NASA ADS] [CrossRef] [Google Scholar]
- Zhao, J., Morris, M. R., Goss, W. M., & An, T. 2009, ApJ, 699, 186 [NASA ADS] [CrossRef] [Google Scholar]
- Ziurys, L. M., Friberg, P., & Irvine, W. M. 1989, ApJ, 343, 201 [NASA ADS] [CrossRef] [PubMed] [Google Scholar]
All Tables
All Figures
|
Fig. 1 Three-color composite image of the CND around Sgr A∗ including the emission of SiO (red), CN (green), H2CO (blue). The central glow shows an artistic representation of the pervasive X-ray and UV-fields from the black hole and central star cluster. In the center, the black hole position is illustrated with a size corresponding to the map resolution. |
| In the text | |
|
Fig. 2 Central position and primary beam of each of the 9-field mosaic observations. Background image is the HCN 4−3 emission by Montero-Castaño et al. (2009). The different molecular structures labels are adopted from Christopher et al. (2005) and Montero-Castaño et al. (2009). |
| In the text | |
|
Fig. 3 Sample spectra extracted from a 4″ size square region at the position 1 indicated in Fig. 4. The spectra of both USB and LSB are shown with the identified spectral transitions labeled. |
| In the text | |
|
Fig. 4 Natural weighted integrated intensity maps of all detected species in this work. Beam size of 4.1″ × 2.9″ is shown in the lower left corner of each box. Emission was integrated over the velocity range between −140 and +140 km s-1 for SiO, C3H2, and HC3N, while we used the velocity ranges of [−190, +470] for CN, [−80, +140] for H2CO, and [−190, +350] for 13CN (see Sect. 3 for details). Background image corresponds to the integrated emission of CN. Contour levels are at 2σ (with σ = 2.3 Jy beam-1 km s-1) steps for all maps but for CN, where the first contour is 3σ and increases in 8σ steps. |
| In the text | |
|
Fig. 5 Comparison between the HCN 4−3 integrated emission (color; Montero-Castaño et al. 2009) and the CN integrated emission (contours). Contour levels start at 3σ and increases in 10σ steps. |
| In the text | |
|
Fig. 6 Photodissociation rate as a function of the visual extinction for each of the species discussed. Rates are extracted from UMIST database (Woodall et al. 2007) and assume the standard ISM UV field (Draine 1978). |
| In the text | |
|
Fig. 7 SiO line width as a function of the position angle on the sky east of north as measured from Sgr A∗. Numbers correspond to Fig. 4 labels. Position 14 and one of the velocity components in position 9 are not shown because of the large uncertainty in the width measurement. The positions with the larger widths at PA around 200° correspond to the southern lobe and southern extension of the CND structure. |
| In the text | |
|
Fig. 8 Continuum-subtracted CN 2−1 spectra extracted from a 4″ box around the Sgr A∗ position. The thick black line represents the fit performed to the line profile where three velocity components have been considered. Two narrow (~20 km s-1) absorption features are fitted at −157 and −23 km s-1 and a ~100 km s-1 wide feature at −32 km s-1. The thin gray line shows the individual contribution of the narrow −23 km s-1 component and the wide component at −32 km s-1. Vertical lines show the position and relative intensities of each individual CN hyperfine structure transition. The intensities and positions of these lines correspond to the fit results to the wider component. |
| In the text | |
|
Fig. 9 Velocities of each of the CN molecular components fitted at each of the core positions labeled in Fig. 4 as a function of the position angle on the sky east of north as measured from Sgr A∗. Each marker is labeled with the corresponding position where the velocity was measured. The different symbols represent different groups of cores/components: southern CND (filled circles), northern CND (filled squares), 70 km s-1 sources (open squares), 50 km s-1 sources (open triangles), 0 km s-1 sources (stars), and negative velocities sources (open circles). The overlaid lines represent rotating ring models fitted to the core velocities in the southwest lobe (solid line), southern extension (dashed line), and northeast lobe (dotted line). See Sect. 6 for details on the sources and models represented. |
| In the text | |
|
Fig. 10 (Upper) Comparison between the H92α integrated emission (color; Roberts & Goss 1993; Zhao et al. 2009) and the CN integrated emission (contours). CN contour levels are the same as in Fig. 5. (Lower) Comparison between the H92α integrated emission (color; Roberts & Goss 1993; Zhao et al. 2009) and the SiO integrated emission (contours). SiO contour levels are the same as in Fig. 4. |
| In the text | |
|
Fig. 11 Comparison between the 6 cm continuum emission (color; Yusef-Zadeh & Morris 1987) and the CN integrated emission (contours). CN contour levels are the same as in Fig. 5. Similar to the comparison with H92α in Fig. 10, the association of the northern arm and the western arc with the northern molecular extension and the southwest lobe can be appreciated. The 6 cm shows the clear extension of the eastern arm northward where it meets the bright molecular northeast lobe. |
| In the text | |
|
Fig. 12 Integrated intensity maps of CN 2−1 in velocity bins of 30 km s-1. Central velocity of each velocity range is displayed in the upper left corner of each panel. First 10 contours are in steps of 3σ, with σ = 0.55 Jy beam-1 km s-1, and subsequently in steps of 6σ. |
| In the text | |
|
Fig. 13 Integrated intensity maps of H2CO 30,3−20,2 in velocity bins of 30 km s-1. Labels and contour steps as in Fig. 12. Note that the observed emission toward the north and east in the −120 and −90 km s-1 maps correspond to the high-velocity emission of HC3N 24−23 (218.324 GHz) detected at the edge of the observed band (Sect. 3). |
| In the text | |
|
Fig. 14 Integrated intensity maps of SiO 5−4 in velocity bins of 30 km s-1. Labels and contour steps as in Fig. 12. |
| In the text | |
|
Fig. 15 Integrated intensity maps of 13CN 2–1 in velocity bins of 30 km s-1. Labels and contour steps as in Fig. 12. |
| In the text | |
|
Fig. 16 Integrated intensity maps of c-C |
| In the text | |
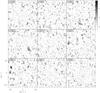 |
Fig. 17 Integrated intensity maps HC3N 25−24. Labels and contour steps as in Fig. 12. |
| In the text | |
|
Fig. 18 Integrated CN/H2CO line ratio in 30 km s-1 velocity bin maps. Color scale is logarithmic. Ratio has been computed in all pixels where CN emission is detected above 3σ. The contours indicate the regions where H2CO has been detected (>3σ). Therefore, values outside these contours represent lower limits to the line ratio where a constant 3σ value has been assumed as the H2CO upper detection limit. |
| In the text | |
|
Fig. 19 Integrated CN/SiO line ratio in 30 km s-1 velocity bin maps. Ratio has been calculated as in Fig. 18 where the contour enclose the regions where SiO is detected above a >3σ level. |
| In the text | |
|
Fig. 20 Integrated CN/c-C3H2 line ratio in 30 km s-1 velocity bin maps. Ratio has been calculated as in Fig. 18 where the contour enclose the regions where c-C3H2 is detected above a >3σ level. |
| In the text | |
|
Fig. 21 Integrated CN/HC3N line ratio in 30 km s-1 velocity bin maps. Ratio has been calculated as in Fig. 18 where the contour enclose the regions where HC3N is detected above a >3σ level. |
| In the text | |
|
Fig. 22 Integrated SiO/HC3N line ratio in 30 km s-1 velocity bin maps. Ratio has been calculated in all pixels where SiO emission is detected above 3σ. Similar to Fig. 18, the contour enclose the regions where HC3N is detected above a >3σ level. |
| In the text | |
Current usage metrics show cumulative count of Article Views (full-text article views including HTML views, PDF and ePub downloads, according to the available data) and Abstracts Views on Vision4Press platform.
Data correspond to usage on the plateform after 2015. The current usage metrics is available 48-96 hours after online publication and is updated daily on week days.
Initial download of the metrics may take a while.