Fig. 10
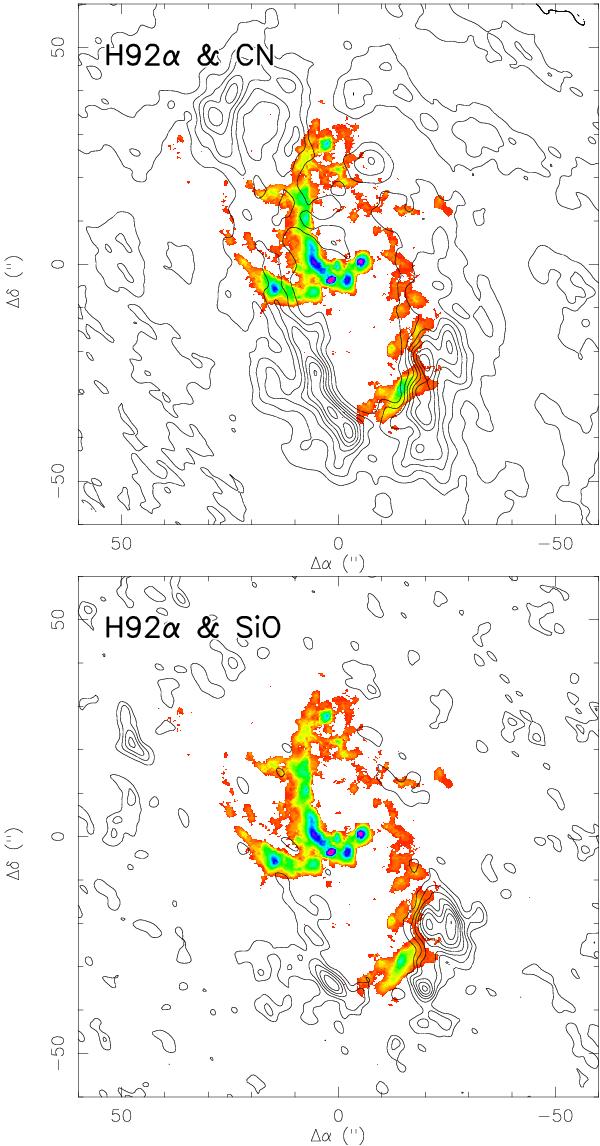
(Upper) Comparison between the H92α integrated emission (color; Roberts & Goss 1993; Zhao et al. 2009) and the CN integrated emission (contours). CN contour levels are the same as in Fig. 5. (Lower) Comparison between the H92α integrated emission (color; Roberts & Goss 1993; Zhao et al. 2009) and the SiO integrated emission (contours). SiO contour levels are the same as in Fig. 4.
Current usage metrics show cumulative count of Article Views (full-text article views including HTML views, PDF and ePub downloads, according to the available data) and Abstracts Views on Vision4Press platform.
Data correspond to usage on the plateform after 2015. The current usage metrics is available 48-96 hours after online publication and is updated daily on week days.
Initial download of the metrics may take a while.