| Issue |
A&A
Volume 539, March 2012
|
|
|---|---|---|
| Article Number | A29 | |
| Number of page(s) | 25 | |
| Section | Interstellar and circumstellar matter | |
| DOI | https://doi.org/10.1051/0004-6361/201117268 | |
| Published online | 22 February 2012 | |
Online material
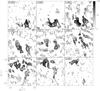 |
Fig. 12
Integrated intensity maps of CN 2−1 in velocity bins of 30 km s-1. Central velocity of each velocity range is displayed in the upper left corner of each panel. First 10 contours are in steps of 3σ, with σ = 0.55 Jy beam-1 km s-1, and subsequently in steps of 6σ. |
| Open with DEXTER | |
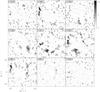 |
Fig. 13
Integrated intensity maps of H2CO 30,3−20,2 in velocity bins of 30 km s-1. Labels and contour steps as in Fig. 12. Note that the observed emission toward the north and east in the −120 and −90 km s-1 maps correspond to the high-velocity emission of HC3N 24−23 (218.324 GHz) detected at the edge of the observed band (Sect. 3). |
| Open with DEXTER | |
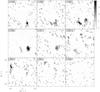 |
Fig. 14
Integrated intensity maps of SiO 5−4 in velocity bins of 30 km s-1. Labels and contour steps as in Fig. 12. |
| Open with DEXTER | |
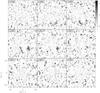 |
Fig. 15
Integrated intensity maps of 13CN 2–1 in velocity bins of 30 km s-1. Labels and contour steps as in Fig. 12. |
| Open with DEXTER | |
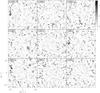 |
Fig. 16
Integrated intensity maps of c-C |
| Open with DEXTER | |

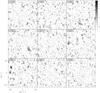 |
Fig. 17
Integrated intensity maps HC3N 25−24. Labels and contour steps as in Fig. 12. |
| Open with DEXTER | |
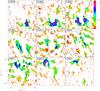 |
Fig. 18
Integrated CN/H2CO line ratio in 30 km s-1 velocity bin maps. Color scale is logarithmic. Ratio has been computed in all pixels where CN emission is detected above 3σ. The contours indicate the regions where H2CO has been detected (>3σ). Therefore, values outside these contours represent lower limits to the line ratio where a constant 3σ value has been assumed as the H2CO upper detection limit. |
| Open with DEXTER | |
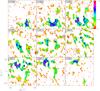 |
Fig. 19
Integrated CN/SiO line ratio in 30 km s-1 velocity bin maps. Ratio has been calculated as in Fig. 18 where the contour enclose the regions where SiO is detected above a >3σ level. |
| Open with DEXTER | |
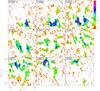 |
Fig. 20
Integrated CN/c-C3H2 line ratio in 30 km s-1 velocity bin maps. Ratio has been calculated as in Fig. 18 where the contour enclose the regions where c-C3H2 is detected above a >3σ level. |
| Open with DEXTER | |
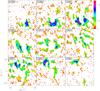 |
Fig. 21
Integrated CN/HC3N line ratio in 30 km s-1 velocity bin maps. Ratio has been calculated as in Fig. 18 where the contour enclose the regions where HC3N is detected above a >3σ level. |
| Open with DEXTER | |
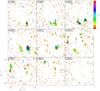 |
Fig. 22
Integrated SiO/HC3N line ratio in 30 km s-1 velocity bin maps. Ratio has been calculated in all pixels where SiO emission is detected above 3σ. Similar to Fig. 18, the contour enclose the regions where HC3N is detected above a >3σ level. |
| Open with DEXTER | |
CN and 13CN Gaussian fit parameters on selected positions.
H2CO, SiO, c-C3H2 and HC3N Gaussian fit parameters on selected positions.
© ESO, 2012
Current usage metrics show cumulative count of Article Views (full-text article views including HTML views, PDF and ePub downloads, according to the available data) and Abstracts Views on Vision4Press platform.
Data correspond to usage on the plateform after 2015. The current usage metrics is available 48-96 hours after online publication and is updated daily on week days.
Initial download of the metrics may take a while.