Fig. 13
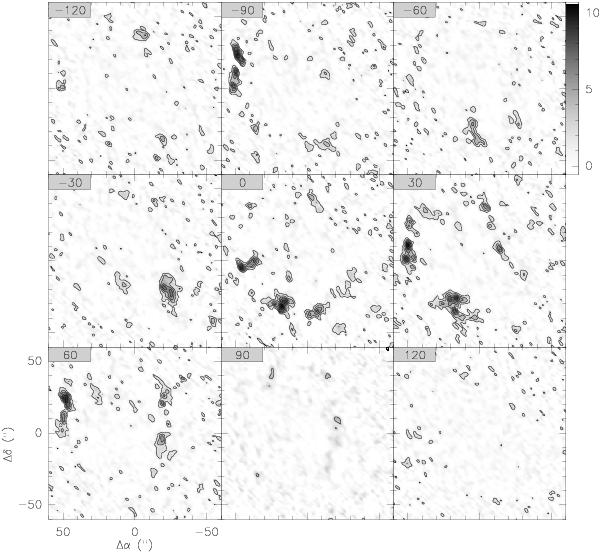
Integrated intensity maps of H2CO 30,3−20,2 in velocity bins of 30 km s-1. Labels and contour steps as in Fig. 12. Note that the observed emission toward the north and east in the −120 and −90 km s-1 maps correspond to the high-velocity emission of HC3N 24−23 (218.324 GHz) detected at the edge of the observed band (Sect. 3).
Current usage metrics show cumulative count of Article Views (full-text article views including HTML views, PDF and ePub downloads, according to the available data) and Abstracts Views on Vision4Press platform.
Data correspond to usage on the plateform after 2015. The current usage metrics is available 48-96 hours after online publication and is updated daily on week days.
Initial download of the metrics may take a while.