Free Access
Fig. 21
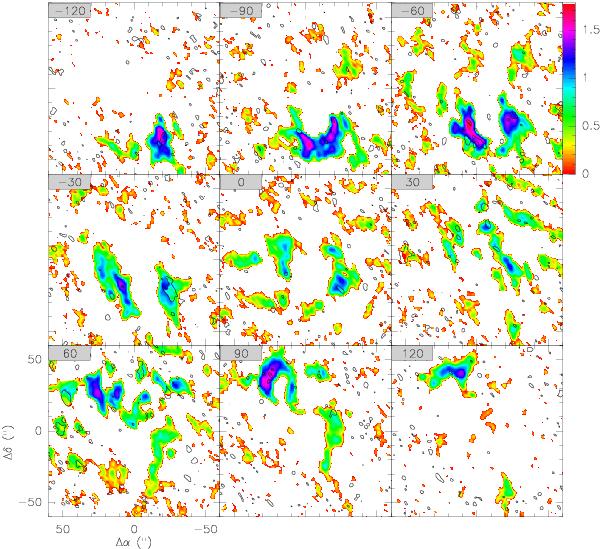
Integrated CN/HC3N line ratio in 30 km s-1 velocity bin maps. Ratio has been calculated as in Fig. 18 where the contour enclose the regions where HC3N is detected above a >3σ level.
Current usage metrics show cumulative count of Article Views (full-text article views including HTML views, PDF and ePub downloads, according to the available data) and Abstracts Views on Vision4Press platform.
Data correspond to usage on the plateform after 2015. The current usage metrics is available 48-96 hours after online publication and is updated daily on week days.
Initial download of the metrics may take a while.