Fig. 11
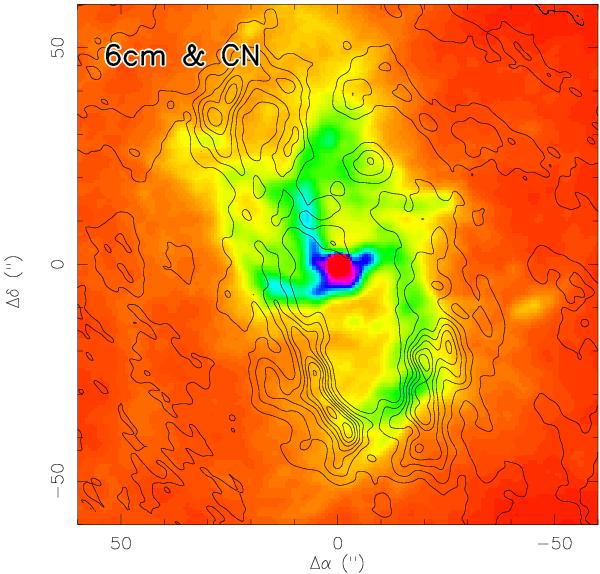
Comparison between the 6 cm continuum emission (color; Yusef-Zadeh & Morris 1987) and the CN integrated emission (contours). CN contour levels are the same as in Fig. 5. Similar to the comparison with H92α in Fig. 10, the association of the northern arm and the western arc with the northern molecular extension and the southwest lobe can be appreciated. The 6 cm shows the clear extension of the eastern arm northward where it meets the bright molecular northeast lobe.
Current usage metrics show cumulative count of Article Views (full-text article views including HTML views, PDF and ePub downloads, according to the available data) and Abstracts Views on Vision4Press platform.
Data correspond to usage on the plateform after 2015. The current usage metrics is available 48-96 hours after online publication and is updated daily on week days.
Initial download of the metrics may take a while.