Fig. 4
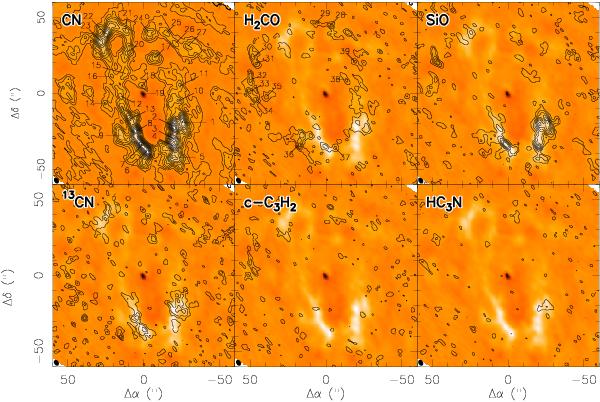
Natural weighted integrated intensity maps of all detected species in this work. Beam size of 4.1″ × 2.9″ is shown in the lower left corner of each box. Emission was integrated over the velocity range between −140 and +140 km s-1 for SiO, C3H2, and HC3N, while we used the velocity ranges of [−190, +470] for CN, [−80, +140] for H2CO, and [−190, +350] for 13CN (see Sect. 3 for details). Background image corresponds to the integrated emission of CN. Contour levels are at 2σ (with σ = 2.3 Jy beam-1 km s-1) steps for all maps but for CN, where the first contour is 3σ and increases in 8σ steps.
Current usage metrics show cumulative count of Article Views (full-text article views including HTML views, PDF and ePub downloads, according to the available data) and Abstracts Views on Vision4Press platform.
Data correspond to usage on the plateform after 2015. The current usage metrics is available 48-96 hours after online publication and is updated daily on week days.
Initial download of the metrics may take a while.