Fig. 9
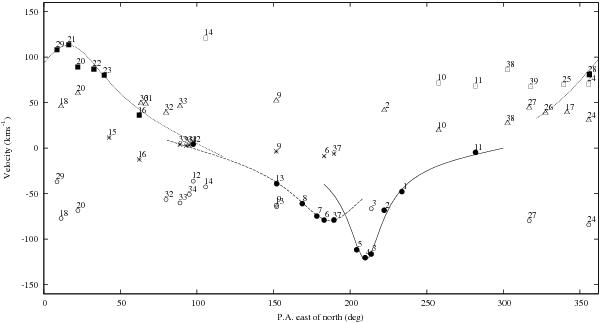
Velocities of each of the CN molecular components fitted at each of the core positions labeled in Fig. 4 as a function of the position angle on the sky east of north as measured from Sgr A∗. Each marker is labeled with the corresponding position where the velocity was measured. The different symbols represent different groups of cores/components: southern CND (filled circles), northern CND (filled squares), 70 km s-1 sources (open squares), 50 km s-1 sources (open triangles), 0 km s-1 sources (stars), and negative velocities sources (open circles). The overlaid lines represent rotating ring models fitted to the core velocities in the southwest lobe (solid line), southern extension (dashed line), and northeast lobe (dotted line). See Sect. 6 for details on the sources and models represented.
Current usage metrics show cumulative count of Article Views (full-text article views including HTML views, PDF and ePub downloads, according to the available data) and Abstracts Views on Vision4Press platform.
Data correspond to usage on the plateform after 2015. The current usage metrics is available 48-96 hours after online publication and is updated daily on week days.
Initial download of the metrics may take a while.