Fig. 8
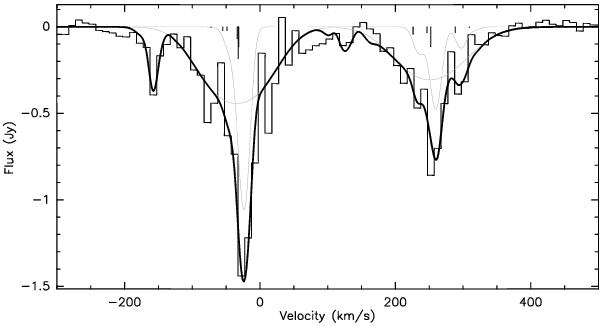
Continuum-subtracted CN 2−1 spectra extracted from a 4″ box around the Sgr A∗ position. The thick black line represents the fit performed to the line profile where three velocity components have been considered. Two narrow (~20 km s-1) absorption features are fitted at −157 and −23 km s-1 and a ~100 km s-1 wide feature at −32 km s-1. The thin gray line shows the individual contribution of the narrow −23 km s-1 component and the wide component at −32 km s-1. Vertical lines show the position and relative intensities of each individual CN hyperfine structure transition. The intensities and positions of these lines correspond to the fit results to the wider component.
Current usage metrics show cumulative count of Article Views (full-text article views including HTML views, PDF and ePub downloads, according to the available data) and Abstracts Views on Vision4Press platform.
Data correspond to usage on the plateform after 2015. The current usage metrics is available 48-96 hours after online publication and is updated daily on week days.
Initial download of the metrics may take a while.