


| Issue |
A&A
Volume 711, July 2026
Euclid Quick Data Release (Q1)
|
|
|---|---|---|
| Article Number | A15 | |
| Number of page(s) | 25 | |
| Section | Extragalactic astronomy | |
| DOI | https://doi.org/10.1051/0004-6361/202554582 | |
| Published online | 30 June 2026 | |
Euclid Quick Data Release (Q1)
XV. A probabilistic classification of quenched galaxies
1
Kapteyn Astronomical Institute, University of Groningen, PO Box 800, 9700 AV Groningen, The Netherlands
2
Departamento de Física Teórica, Facultad de Ciencias, Universidad Autónoma de Madrid, 28049
Cantoblanco,
Madrid, Spain
3
Centro de Investigación Avanzada en Física Fundamental (CIAFF), Facultad de Ciencias, Universidad Autónoma de Madrid, 28049 Madrid, Spain
4
Institute of Cosmology and Gravitation, University of Portsmouth, Portsmouth PO1 3FX, UK
5
INAF-Osservatorio Astronomico di Trieste, Via G. B. Tiepolo 11, 34143 Trieste, Italy
6
Université Paris Cité, CNRS, Astroparticule et Cosmologie, 75013 Paris, France
7
IFPU, Institute for Fundamental Physics of the Universe, via Beirut 2, 34151 Trieste, Italy
8
INAF-Osservatorio Astronomico di Capodimonte, Via Moiariello 16, 80131 Napoli, Italy
9
School of Physics and Astronomy, Cardiff University, The Parade, Cardiff CF24 3AA, UK
10
ESAC/ESA, Camino Bajo del Castillo, s/n., Urb. Villafrfraca del Castillo, 28692 Villanueva de la Cañada, Madrid, Spain
11
Institut d’Astrophysique de Paris, UMR 7095, CNRS, and Sorbonne Université, 98 bis boulevard Arago, 75014 Paris, France
12
STAR Institute, University of Liège, Quartier Agora, Allée du six Août 19c, 4000 Liège, Belgium
13
Sterrenkundig Observatorium, Universiteit Gent, Krijgslaan 281 S9, 9000 Gent, Belgium
14
School of Physics & Astronomy, University of Southampton, Highfield Campus, Southampton SO17 1BJ, UK
15
Instituto de Astrofísica de Canarias, Vía Láctea, 38205 La Laguna,
Tenerife,
Spain
16
Universidad de La Laguna, Departamento de Astrofísica, 38206 La Laguna,
Tenerife,
Spain
17
Instituto de Astrofísica de Canarias (IAC), Departamento de Astrofísica, Universidad de La Laguna (ULL), 38200 La Laguna,
Tenerife,
Spain
18
Universitü Paris-Saclay, CNRS, Institut d’astrophysique spatiale, 91405 Orsay, France
19
School of Mathematics and Physics, University of Surrey, Guildford, Surrey GU2 7XH, UK
20
INAF-Osservatorio Astronomico di Brera, Via Brera 28, 20122 Milano, Italy
21
Universitü Paris-Saclay, Université Paris Cité, CEA, CNRS, AIM, 91191 Gif-sur-Yvette, France
22
INFN, Sezione di Trieste, Via Valerio 2, 34127 Trieste TS, Italy
23
SISSA, International School for Advanced Studies, Via Bonomea 265, 34136 Trieste TS, Italy
24
Dipartimento di Fisica e Astronomia, Università di Bologna, Via Gobetti 93/2, 40129 Bologna, Italy
25
INAF-Osservatorio di Astrofisica e Scienza dello Spazio di Bologna, Via Piero Gobetti 93/3, 40129 Bologna, Italy
26
INFN-Sezione di Bologna, Viale Berti Pichat 6/2, 40127 Bologna, Italy
27
INAF-Osservatorio Astronomico di Padova, Via dell’Osservatorio 5, 35122 Padova, Italy
28
Space Science Data Center, Italian Space Agency, via del Politecnico snc, 00133 Roma, Italy
29
INAF-Osservatorio Astrofisico di Torino, Via Osservatorio 20, 10025 Pino Torinese
( TO),
Italy
30
Dipartimento di Fisica, Università di Genova, Via Dodecaneso 33, 16146 Genova, Italy
31
INFN-Sezione di Genova, Via Dodecaneso 33, 16146 Genova, Italy
32
Department of Physics “E. Pancini”, University Federico II, Via Cinthia 6, 80126 Napoli, Italy
33
Instituto de Astrofísica e Ciências do Espaço, Universidade do Porto, CAUP, Rua das Estrelas, PT4150-762 Porto, Portugal
34
Faculdade de Ciências da Universidade do Porto, Rua do Campo de Alegre, 4150-007 Porto, Portugal
35
European Space Agency/ESTEC, Keplerlaan 1, 2201 AZ Noordwijk, The Netherlands
36
Institute Lorentz, Leiden University, Niels Bohrweg 2, 2333 CA Leiden, The Netherlands
37
Leiden Observatory, Leiden University, Einsteinweg 55, 2333 CC Leiden, The Netherlands
38
INAF-IASF Milano, Via Alfonso Corti 12, 20133 Milano, Italy
39
Centro de Investigaciones Energéticas, Medioambientales y Tecnológicas (CIEMAT), Avenida Complutense 40, 28040 Madrid, Spain
40
Port d’Informació Científica, Campus UAB, C. Albareda s/n, 08193 Bellaterra
(Barcelona),
Spain
41
Institute for Theoretical Particle Physics and Cosmology (TTK), RWTH Aachen University, 52056 Aachen, Germany
42
Institute of Space Sciences (ICE, CSIC), Campus UAB, Carrer de Can Magrans, s/n, 08193 Barcelona, Spain
43
Institut d’Estudis Espacials de Catalunya (IEEC), Edifici RDIT, Campus UPC, 08860 Castelldefels,
Barcelona,
Spain
44
INAF-Osservatorio Astronomico di Roma, Via Frascati 33, 00078 Monteporzio Catone, Italy
45
INFN section of Naples, Via Cinthia 6, 80126 Napoli, Italy
46
Institute for Astronomy, University of Hawaii, 2680 Woodlawn Drive, Honolulu, HI 96822, USA
47
Dipartimento di Fisica e Astronomia “Augusto Righi” – Alma Mater Studiorum Università di Bologna, Viale Berti Pichat 6/2, 40127 Bologna, Italy
48
Institute for Astronomy, University of Edinburgh, Royal Observatory, Blackford Hill, Edinburgh EH9 3HJ, UK
49
Jodrell Bank Centre for Astrophysics, Department of Physics and Astronomy, University of Manchester, Oxford Road, Manchester M13 9PL, UK
50
European Space Agency/ESRIN, Largo Galileo Galilei 1, 00044 Frascati, Roma, Italy
51
Université Claude Bernard Lyon 1, CNRS/IN2P3, IP2I Lyon, UMR 5822, Villeurbanne F-69100, France
52
Aix-Marseille Université, CNRS, CNES, LAM, Marseille, France
53
Institut de Ciències del Cosmos (ICCUB), Universitat de Barcelona (IEEC-UB), Martí i Franquès 1, 08028 Barcelona, Spain
54
Institució Catalana de Recerca i Estudis Avançats (ICREA), Passeig de Lluís Companys 23, 08010 Barcelona, Spain
55
UCB Lyon 1, CNRS/IN2P3, IUF, IP2I Lyon, 4 rue Enrico Fermi, 69622 Villeurbanne, France
56
Mullard Space Science Laboratory, University College London,
Holmbury St Mary,
Dorking, Surrey RH5 6NT, UK
57
Departamento de Física, Faculdade de Ciências, Universidade de Lisboa, Edifício C8, Campo Grande, PT1749-016 Lisboa, Portugal
58
Instituto de Astrofísica e Ciências do Espaço, Faculdade de Ciências, Universidade de Lisboa, Campo Grande, 1749-016 Lisboa, Portugal
59
Department of Astronomy, University of Geneva, ch. d’Ecogia 16, 1290 Versoix, Switzerland
60
INAF-Istituto di Astrofisica e Planetologia Spaziali, via del Fosso del Cavaliere, 100, 00100 Roma, Italy
61
Aix-Marseille Université, CNRS/IN2P3, CPPM, Marseille, France
62
INFN-Bologna, Via Irnerio 46, 40126 Bologna, Italy
63
School of Physics, HH Wills Physics Laboratory, University of Bristol, Tyndall Avenue, Bristol BS8 1TL, UK
64
Universitäts-Sternwarte München, Fakultät für Physik, Ludwig-Maximilians-Universität München, Scheinerstrasse 1, 81679 München, Germany
65
Max Planck Institute for Extraterrestrial Physics, Giessenbachstr. 1, 85748 Garching, Germany
66
Dipartimento di Fisica “Aldo Pontremoli”, Università degli Studi di Milano, Via Celoria 16, 20133 Milano, Italy
67
INFN-Sezione di Milano, Via Celoria 16, 20133 Milano, Italy
68
NRC Herzberg, 5071 West Saanich Rd, Victoria, BC V9E 2E7, Canada
69
Institute of Theoretical Astrophysics, University of Oslo, P.O. Box 1029 Blindern, 0315 Oslo, Norway
70
Jet Propulsion Laboratory, California Institute of Technology, 4800 Oak Grove Drive, Pasadena, CA 91109, USA
71
Department of Physics, Lancaster University, Lancaster LA1 4YB, UK
72
Felix Hormuth Engineering, Goethestr. 17, 69181 Leimen, Germany
73
Technical University of Denmark, Elektrovej 327, 2800
Kgs. Lyngby,
Denmark
74
Cosmic Dawn Center (DAWN), Copenhagen, Denmark
75
Max-Planck-Institut für Astronomie, Königstuhl 17, 69117 Heidelberg, Germany
76
NASA Goddard Space Flight Center, Greenbelt, MD 20771, USA
77
Department of Physics and Helsinki Institute of Physics, Gustaf Hällströmin katu 2, 00014 University of Helsinki, Helsinki, Finland
78
Université de Genève, Département de Physique Théorique and Centre for Astroparticle Physics, 24 quai Ernest-Ansermet, CH-1211 Genève 4, Switzerland
79
Department of Physics, P.O. Box 64, 00014 University of Helsinki, Finland
80
Helsinki Institute of Physics, Gustaf Hällströmin katu 2, University of Helsinki, Helsinki, Finland
81
Centre de Calcul de l’IN2P3/CNRS, 21 avenue, Pierre de Coubertin, 69627 Villeurbanne Cedex, France
82
Laboratoire d’etude de l’Univers et des phenomenes eXtremes, Observatoire de Paris, Université PSL, Sorbonne Université, CNRS, 92190 Meudon, France
83
SKA Observatory, Jodrell Bank,
Lower Withington,
Macclesfield, Cheshire SK11 9FT, UK
84
University of Applied Sciences and Arts of Northwestern Switzerland, School of Computer Science, 5210 Windisch, Switzerland
85
Universität Bonn, Argelander-Institut für Astronomie, Auf dem Hügel 71, 53121 Bonn, Germany
86
INFN-Sezione di Roma,
Piazzale Aldo Moro, 2 – c/o Dipartimento di Fisica, Edificio G. Marconi,
00185 Roma, Italy
87
Dipartimento di Fisica e Astronomia “Augusto Righi” – Alma Mater Studiorum Università di Bologna, via Piero Gobetti 93/2, 40129 Bologna, Italy
88
Department of Physics, Institute for Computational Cosmology, Durham University, South Road, Durham DH1 3LE, UK
89
Université Côte d’Azur, Observatoire de la Côte d’Azur, CNRS, Laboratoire Lagrange, Bd de l’Observatoire, CS 34229, 06304 Nice cedex 4, France
90
CNRS-UCB International Research Laboratory, Centre Pierre Binétruy, IRL2007, CPB-IN2P3, Berkeley, USA
91
University of Applied Sciences and Arts of Northwestern Switzerland, School of Engineering, 5210 Windisch, Switzerland
92
Institut d’Astrophysique de Paris, 98bis Boulevard Arago, 75014 Paris, France
93
Institute of Physics, Laboratory of Astrophysics, Ecole Polytechnique Fédérale de Lausanne (EPFL), Observatoire de Sauverny, 1290 Versoix, Switzerland
94
Aurora Technology for European Space Agency (ESA), Camino bajo del Castillo, s/n, Urbanizacion Villafranca del Castillo, Villanueva de la Cañada, 28692 Madrid, Spain
95
Institut de Física d’Altes Energies (IFAE), The Barcelona Institute of Science and Technology, Campus UAB, 08193 Bellaterra
(Barcelona),
Spain
96
School of Mathematics, Statistics and Physics, Newcastle University, Herschel Building, Newcastle-upon-Tyne NE1 7RU, UK
97
Waterloo Centre for Astrophysics, University of Waterloo, Waterloo, Ontario N2L 3G1, Canada
98
Department of Physics and Astronomy, University of Waterloo, Waterloo, Ontario N2L 3G1, Canada
99
Perimeter Institute for Theoretical Physics, Waterloo, Ontario N2L 2Y5, Canada
100
Centre National d’Etudes Spatiales – Centre spatial de Toulouse, 18 avenue Edouard Belin, 31401 Toulouse Cedex 9, France
101
Institute of Space Science, Str. Atomistilor, nr. 409
Mãgurele,
Ilfov 077125, Romania
102
Consejo Superior de Investigaciones Cientificas, Calle Serrano 117, 28006 Madrid, Spain
103
Dipartimento di Fisica e Astronomia “G. Galilei”, Università di Padova, Via Marzolo 8, 35131 Padova, Italy
104
INFN-Padova, Via Marzolo 8, 35131 Padova, Italy
105
Institut für Theoretische Physik, University of Heidelberg, Philosophenweg 16, 69120 Heidelberg, Germany
106
Institut de Recherche en Astrophysique et Planétologie (IRAP), Université di Toulouse, CNRS, UPS, CNES, 14 Av. Edouard Belin, 31400 Toulouse, France
107
Université St Joseph, Faculty of Sciences, Beirut, Lebanon
108
Departamento de Física, FCFM, Universidad de Chile, Blanco Encalada 2008, Santiago, Chile
109
Universität Innsbruck, Institut für Astro- und Teilchenphysik, Technikerstr. 25/8, 6020 Innsbruck, Austria
110
Satlantis, University Science Park,
Sede Bld 48940,
Leioa-Bilbao, Spain
111
Instituto de Astrofísica e Ciências do Espaço, Faculdade de Ciências, Universidade de Lisboa,
Tapada da Ajuda,
1349-018 Lisboa, Portugal
112
Department of Physics and Astronomy, University College London, Gower Street, London WC1E 6BT, UK
113
Niels Bohr Institute, University of Copenhagen, Jagtvej 128, 2200 Copenhagen, Denmark
114
Universidad Politécnica de Cartagena, Departamento de Electrónica y Tecnología de Computadoras, Plaza del Hospital 1, 30202 Cartagena, Spain
115
Infrared Processing and Analysis Center, California Institute of Technology, Pasadena, CA 91125, USA
116
Dipartimento di Fisica e Scienze della Terra, Università degli Studi di Ferrara, Via Giuseppe Saragat 1, 44122 Ferrara, Italy
117
Istituto Nazionale di Fisica Nucleare, Sezione di Ferrara, Via Giuseppe Saragat 1, 44122 Ferrara, Italy
118
INAF, Istituto di Radioastronomia, Via Piero Gobetti 101, 40129 Bologna, Italy
119
Department of Physics, Oxford University, Keble Road, Oxford OX1 3RH, UK
120
Université PSL, Observatoire de Paris, Sorbonne Université, CNRS, LERMA, 75014 Paris, France
121
Université Paris-Cité, 5 Rue Thomas Mann, 75013 Paris, France
122
INAF – Osservatorio Astronomico di Brera, via Emilio Bianchi 46, 23807 Merate, Italy
123
INAF-Osservatorio Astronomico di Brera, Via Brera 28, 20122 Milano, Italy
INFN-Sezione di Genova, Via Dodecaneso 33, 16146 Genova, Italy
124
ICL, Junia, Université Catholique de Lille, LITL, 59000 Lille, France
125
ICSC – Centro Nazionale di Ricerca in High Performance Computing, Big Data e Quantum Computing, Via Magnanelli 2, Bologna, Italy
126
Instituto de Física Teórica UAM-CSIC,
Campus de Cantoblanco,
28049 Madrid, Spain
127
CERCA/ISO, Department of Physics, Case Western Reserve University, 10900 Euclid Avenue, Cleveland, OH 44106, USA
128
Technical University of Munich, TUM School of Natural Sciences, Physics Department, James-Franck-Str. 1, 85748 Garching, Germany
129
Max-Planck-Institut für Astrophysik, Karl-Schwarzschild-Str. 1, 85748 Garching, Germany
130
Laboratoire Univers et Théorie, Observatoire de Paris, Université PSL, Université Paris Cité, CNRS, 92190 Meudon, France
131
Departamento de Física Fundamental, Universidad de Salamanca,
Plaza de la Merced s/n,
37008 Salamanca, Spain
132
Université de Strasbourg, CNRS, Observatoire astronomique de Strasbourg, UMR 7550, 67000 Strasbourg, France
133
Center for Data-Driven Discovery, Kavli IPMU (WPI), UTIAS, The University of Tokyo, Kashiwa, Chiba 277-8583, Japan
134
Dipartimento di Fisica – Sezione di Astronomia, Università di Trieste, Via Tiepolo 11, 34131 Trieste, Italy
135
California Institute of Technology, 1200 E California Blvd, Pasadena, CA 91125, USA
136
Department of Physics & Astronomy, University of California Irvine, Irvine, CA 92697, USA
137
Department of Mathematics and Physics E. De Giorgi, University of Salento, Via per Arnesano, CP-I93, 73100 Lecce, Italy
138
INFN, Sezione di Lecce, Via per Arnesano, CP-193, 73100 Lecce, Italy
139
INAF-Sezione di Lecce,
c/o Dipartimento Matematica e Fisica,
Via per Arnesano, 73100 Lecce, Italy
140
Departamento Física Aplicada, Universidad Politécnica de Cartagena,
Campus Muralla del Mar,
30202 Cartagena, Murcia, Spain
141
Instituto de Física de Cantabria, Edificio Juan Jordá, Avenida de los Castros, 39005 Santander, Spain
142
CEA Saclay, DFR/IRFU, Service d’Astrophysique,
Bat. 709,
91191 Gif-sur-Yvette, France
143
Department of Computer Science, Aalto University, PO Box 15400 Espoo FI-00076, Finland
144
Instituto de Astrofísica de Canarias, c/ Via Lactea s/n, La Laguna 38200, Spain
Departamento de Astrofísica de la Universidad de La Laguna, Avda. Francisco Sanchez, La Laguna 38200, Spain
145
Caltech/IPAC, 1200 E. California Blvd., Pasadena, CA 91125, USA
146
Ruhr University Bochum, Faculty of Physics and Astronomy, Astronomical Institute (AIRUB), German Centre for Cosmological Lensing (GCCL), 44780 Bochum, Germany
147
DARK, Niels Bohr Institute, University of Copenhagen, Jagtvej 155, 2200 Copenhagen, Denmark
148
Department of Physics and Astronomy, Vesilinnantie 5, 20014 University of Turku, Turku, Finland
149
Serco for European Space Agency (ESA), Camino bajo del Castillo, s/n, Urbanizacion Villafranca del Castillo, Villanueva de la Cañada, 28692 Madrid, Spain
150
ARC Centre of Excellence for Dark Matter Particle Physics, Melbourne, Australia
151
Centre for Astrophysics & Supercomputing, Swinburne University of Technology, Hawthorn, Victoria 3122, Australia
152
Department of Physics and Astronomy, University of the Western Cape, Bellville, Cape Town 7535, South Africa
153
DAMTP, Centre for Mathematical Sciences, Wilberforce Road, Cambridge CB3 0WA, UK
154
Kavli Institute for Cosmology Cambridge, Madingley Road, Cambridge CB3 0HA, UK
155
Department of Astrophysics, University of Zurich, Winterthurerstrasse 190, 8057 Zurich, Switzerland
156
Department of Physics, Centre for Extragalactic Astronomy, Durham University, South Road, Durham DH1 3LE, UK
157
IRFU, CEA, Université Paris-Saclay, 91191 Gif-sur-Yvette Cedex, France
158
Oskar Klein Centre for Cosmoparticle Physics, Department of Physics, Stockholm University, Stockholm SE-106 91, Sweden
159
Astrophysics Group, Blackett Laboratory, Imperial College London, London SW7 2AZ, UK
160
Univ. Grenoble Alpes, CNRS, Grenoble INP, LPSC-IN2P3, 53, Avenue des Martyrs, 38000 Grenoble, France
161
INAF-Osservatorio Astrofisico di Arcetri, Largo E. Fermi 5, 50125 Firenze, Italy
162
Dipartimento di Fisica, Sapienza Università di Roma,
Piazzale Aldo Moro 2,
00185 Roma, Italy
163
Centro de Astrofísica da Universidade do Porto, Rua das Estrelas, 4150-762 Porto, Portugal
164
HE Space for European Space Agency (ESA), Camino bajo del Castillo, s/n, Urbanizacion Villafranca del Castillo, Villanueva de la Cañada, 28692 Madrid, Spain
165
Department of Astrophysical Sciences, Peyton Hall, Princeton University, Princeton, NJ 08544, USA
166
Theoretical astrophysics, Department of Physics and Astronomy, Uppsala University, Box 516, 751 37 Uppsala, Sweden
167
Minnesota Institute for Astrophysics, University of Minnesota, 116 Church St SE, Minneapolis, MN 55455, USA
168
Mathematical Institute, University of Leiden, Einsteinweg 55, 2333 CA Leiden, The Netherlands
169
Institute of Astronomy, University of Cambridge, Madingley Road, Cambridge CB3 0HA, UK
170
Department of Physics and Astronomy, University of California, Davis, CA 95616, USA
171
Space physics and astronomy research unit, University of Oulu, Pentti Kaiteran katu 1, FI-90014 Oulu, Finland
172
Center for Computational Astrophysics, Flatiron Institute, 162 5th Avenue, 10010 New York, NY, USA
173
Department of Astronomy, University of Massachusetts, Amherst, MA 01003, USA
174
Univ. Lille, CNRS, Centrale Lille, UMR 9189 CRIStAL, 59000 Lille, France
★ Corresponding author: This email address is being protected from spambots. You need JavaScript enabled to view it.
Received:
17
March
2025
Accepted:
13
June
2025
Abstract
Investigating what drives the quenching of star formation in galaxies is key to understanding their evolution. The Euclid mission will provide rich spatial and spectral data from optical to infrared wavelengths for millions of galaxies, and enable precise measurements of their star formation histories. Using the first Euclid Quick Data Release (Q1), we developed a probabilistic classification framework that combines the average specific star-formation rate (sSFRlog(τ)) inferred over two timescales (τ = 108, 109 yr) to categorise galaxies as ‘ageing’ (secularly evolving), ‘quenched’ (recently halted star formation), or ‘retired’ (dominated by old stars). We validated this methodology using synthetic observations from the IllustrisTNG simulation. Two classification methods were employed: a probabilistic approach, which integrates posterior distributions, and a model-driven method, which optimises sample purity and completeness using IllustrisTNG. At z < 0.1 and M* ≳ 3 × 10⁸ M⊙, we obtain Euclid class fractions of 68–72%, 8–17%, and 14–19% for ageing, quenched, and retired populations, respectively, which is consistent with previous studies. Ageing and retired galaxies dominate at the low- and high-mass end, respectively, while quenched galaxies surpass the retired fraction for M* ≲ 1010 M⊙. The evolution with redshift shows increasing and decreasing fractions of ageing and retired galaxies, respectively. The fraction of quenched systems shows a weaker dependence on stellar mass and redshift, varying between 5 and 15%. We find tentative evidence that more massive galaxies usually undergo quenching episodes at earlier times with respect to their low-mass counterparts. We analysed the mass-size-metallicity relation for each population. Ageing galaxies generally exhibit disc morphologies and low metallicities. Retired galaxies show compact structures and enhanced chemical enrichment, while quenched galaxies form an intermediate population that is more compact and chemically evolved than ageing systems. Despite potential selection biases, this work demonstrates Euclid’s great potential for elucidating the physical nature of the quenching mechanisms that govern galaxy evolution.
Key words: galaxies: evolution / galaxies: fundamental parameters / galaxies: general / galaxies: star formation / galaxies: stellar content
© The Authors 2026
 Open Access article, published by EDP Sciences, under the terms of the Creative Commons Attribution License (https://creativecommons.org/licenses/by/4.0), which permits unrestricted use, distribution, and reproduction in any medium, provided the original work is properly cited.
This article is published in open access under the Subscribe to Open model. This email address is being protected from spambots. You need JavaScript enabled to view it. to support open access publication.
1. Introduction
One of the current central questions in galaxy evolution is to identify the main physical processes that govern the specific star-formation rate (sSFR ≡ SFR/M*) and drive the transition from blue star-forming galaxies to red quiescent systems (e.g. Faber et al. 2007; Peng et al. 2010; Schawinski et al. 2014; Casado et al. 2015; Tacchella et al. 2016, 2022; Moutard et al. 2016; Belli et al. 2019). Different approaches have been proposed in the literature to classify these processes in order to gain a deeper understanding of their potential role. Based on their origin (the so-called ‘nature versus nurture’ debate), two broad categories have been proposed: internally triggered mechanisms (‘nature’), such as negative feedback from active galactic nuclei (AGN), supernovae-driven winds (Crenshaw et al. 2003; Di Matteo et al. 2005; Croton et al. 2006; Sawala et al. 2010; Cheung et al. 2016; Fitts et al. 2017), which can expel or heat gas, or morpho-kinematic related effects that prevent gas cloud fragmentation (e.g. Bigiel et al. 2008; Martig et al. 2009; Gensior et al. 2020), versus environmentally driven processes (‘nurture’) such as ram-pressure stripping (able to remove part of or even all the gas reservoir; see e.g. Gunn et al. 1972; Boselli & Gavazzi 2006; Brown et al. 2017), starvation (the suppression of gas infall; see e.g. Larson et al. 1980; Wetzel et al. 2013; Peng et al. 2015), which leads to a suppression of star formation, or galaxy interactions (Moore et al. 1996; Bialas et al. 2015). These mechanisms often act simultaneously or sequentially, and their relative importance may depend on galaxy mass, environment, and redshift. For example, both theoretical predictions and observational evidence suggest that low-mass galaxies are more strongly affected by environmental effects, whereas massive systems are likely dominated by internal processes like AGN feedback (Peng et al. 2010; De Lucia et al. 2012; Corcho-Caballero et al. 2023a).
An alternative and complementary way to distinguish between these physical mechanisms is by their characteristic timescales. In the classical picture (Kormendy & Kennicutt 2004), fast, violent processes are expected to occur on a free-fall (dynamical) scale,  , where ρ is a representative density of the galactic halo. Several of the aforementioned mechanisms, such as galactic outflows, harassment, or ram-pressure stripping, fall into this category. In contrast, other processes, including starvation or morphological transformations, occur on much longer (‘secular’) timescales and require several galactic rotations for their effect on the SFR to be noticed (e.g. Wright et al. 2019; Walters et al. 2022).
A third and final distinction concerns the magnitude of the effect. Some physical mechanisms contribute to ‘regulate’ the efficiency of gas accretion, cooling, and/or conversion into stars through interactions with the interstellar medium (e.g. Booth & Schaye 2009; Hopkins et al. 2012), which leads to smooth or mildly oscillatory star formation histories (SFHs). In particular, any negative ‘feedback’ process whose intensity scales with the star formation activity (e.g. supernovae-driven winds) will drive the system towards a steady-state ‘bathtub’ mode where the SFR is proportional to the gas infall rate (e.g. Bouché et al. 2010; Maiolino & Mannucci 2019, and references therein), but it will never be able to halt it completely unless the cold gas supply is shut down. On the other hand, the strength of other ‘suppressing’ mechanisms is not tied to the SFR, and thus they may reduce it to negligible levels, by extinguishing the gas supply (e.g. starvation, ram-pressure stripping), preventing it from forming stars (e.g. morphological quenching),or both.
In this work, we define ‘quenching’ as a process capable of terminating – or significantly suppressing – the star formation of a galaxy on a short timescale (i.e. less than about 1 Gyr). In contrast, we use the term ‘ageing’ to denote the continuous secular evolution of a galaxy, which encompasses different evolutionary stages from star-forming (including short-lived star-burst episodes) to quiescent phases, driven by the steady consumption of its gas reservoir through uninterrupted star formation (e.g. Casado et al. 2015; Tacchella et al. 2016). All galaxies, blue and red, undergo ageing as their sSFR gradually decreases with time. Discriminating between galaxies that are merely ageing and systems that are also affected by slow suppressing processes (often referred to as ‘slow quenching’; see e.g. Schawinski et al. 2014; Moutard et al. 2016; Belli et al. 2019; Tacchella et al. 2022) on timescales ≳1 Gyr is challenging and, in practice, often impossible. We consider that all these secularly evolving systems belong to the ageing category. At the red end, it is particularly challenging to reconstruct the evolutionary path a galaxy has followed over cosmic time: presently, red objects that have gradually evolved to quiescence appear spectroscopically similar to those that experienced a sudden quenching event in the distant past (e.g. Corcho-Caballero et al. 2023b). We refer to those systems as ‘retired’.
Consequently, we focus on identifying galaxies that show clear evidence of recent quenching and distinguishing them from the ageing and retired populations. To achieve this goal, we previously developed an empirical diagnostic tool based on several observational samples of nearby galaxies (Casado et al. 2015; Corcho-Caballero et al. 2021a, 2023b, hereafter C15, CC21b, and CC23a). The ageing diagram (AD) combines two proxies for star-formation, sensitive to different timescales, to probe the derivative of the recent SFH during the last 1–3 Gyr. Specifically, we used the equivalent width of the Hα line (EW(Hα)) to trace star formation over the last 107 years, while we employed optical colours (u − r and g − r in C15, CC21b, respectively) or the 4000 Å break (CC23a) to trace sSFRs over the last billion years.
Systems with smoothly varying SFHs form a sequence characterised by a tight correlation between these proxies. In contrast, galaxies that recently experienced quenching display suppressed EW(Hα) due to a lack of O and B stars but retain a relatively blue stellar continuum dominated by intermediate-age populations (e.g. A-type stars). We introduced two demarcation lines within the AD to classify galaxies into four domains similar in spirit to the ‘star-forming’, ‘young quiescent’, and ‘old-quiescent’ populations proposed by Moutard et al. (2018): ageing galaxies (AGs) undergoing secular evolution, undetermined galaxies (UGs) with unclear classifications, quenched galaxies (QGs), which show evidence of recent quenching events (≲1 Gyr), and retired galaxies (RGs) at the red end of the diagram where ageing and quenched sequences converge. Inferring the recent SFH in these galaxies is extremely difficult, and one cannot in general discern which path (ageing or quenching) they have followed to reach the retired class.
Numerous studies have sought to identify quenching in the Universe. Early efforts often relied on UV-to-IR photometric measurements to distinguish between star-forming and quiescent galaxies (e.g. Williams et al. 2009; Schawinski et al. 2014). However, these methods can struggle to clearly separate the two populations, particularly if red systems are assumed to always represent quenched galaxies (see e.g. Abramson et al. 2016, for alternative interpretations). Closer to our approach, some previous studies discriminated between fast and slow evolutionary modes combining colours and/or spectral features (e.g. Moutard et al. 2016, 2018, 2020; Cleland & McGee 2021). Finally, recent studies have characterised the time derivative, or simply tracked recent changes, of the SFH in galaxies (Martin et al. 2017; Merlin et al. 2018, 2019; Jiménez-López et al. 2022; Weibel et al. 2023; Aufort et al. 2025). These works often used mock SFHs (either based on analytical models or simulations) to derive synthetic observables, such as broad-band colours or spectral features – e.g. EW(Hα), EW(Hδ), and Dn(4000) – combined with regression techniques to infer SFRs over different timescales.
The European Space Agency’s Euclid mission (Euclid Collaboration: Mellier et al. 2025) offers an unparalleled opportunity to investigate galaxy quenching across cosmic time. The multi-wavelength high-quality photometric and spectroscopic data, across optical-to-IR bands, provided by the Wide (Euclid Collaboration: Scaramella et al. 2022) and Deep (Euclid Collaboration: Mellier et al. 2025) surveys, will enable a detailed reconstruction of the SFHs of galaxies across an unprecedented range of redshifts and stellar masses (e.g. Euclid Collaboration: Bisigello et al. 2023; Euclid Collaboration: Enia et al. 2024; Euclid Collaboration: Abdurro’uf et al. 2025). A key strength of Euclid lies in its high-resolution imaging capabilities, which will allow for an in-depth exploration of the connection between galaxy SFHs and their optical morphologies.
In this paper, we utilise the first Euclid Quick Data Release (Q1; Euclid Collaboration: Aussel et al. 2026) to characterise the SFHs of galaxies and employ a probabilistic framework inspired by previous work using the AD. In Sect. 2, we describe the selection of the Euclid galaxy sample and the numerical simulations from the IllustrisTNG suite that we used to calibrate our methods. The classification scheme and the Bayesian inference of the SFHs is presented in Sects. 3.1 and 3.2, respectively. The validation of our method using IllustrisTNG synthetic data is discussed in Sects. 4.1–4.4. Results from applying the classification framework to the Euclid sample are described in Sect. 4.5, while a discussion in terms of stellar mass and evolution with redshift are presented in Sects. 5.1 and 5.2, respectively. Throughout this work, we adopt a flat ΛCDM cosmology, with H0 = 70 km s−1 Mpc−1 and Ωm = 0.28.
2. Data
In this work, we use a combination of ground- and space-based photometry from the Euclid Quick Release 1 (Sect. 2.1), together with synthetic photometry derived from the IllustrisTNG model (Sect. 2.2), devoted to tailoring the proposed classification scheme and evaluating its performance.
2.1. Euclid
The sample of Euclid galaxies is selected from the three Euclid Deep Fields (EDFs) that form part of Q1 Euclid Collaboration: Aussel et al. (2026). This work uses image data from the Euclid NISP instrument (YE, JE, and HE; see Euclid Collaboration: Jahnke et al. 2025) as well as external data from ground-based surveys. EDF-N ugriz optical imaging data is provided by the Ultraviolet Near Infrared Optical Northern Survey (UNIONS; Gwyn et al. in prep.). The dataset comprises observations performed with the Canada-France-Hawaii Telescope (CFHT) in the u and r bands, i-band data are provided by the Panchromatic Survey Telescope and Rapid Response system (Pan-STARRS; Chambers et al. 2016), whereas g- and z-band imaging is acquired by two programmes using Subaru Hyper Suprime-Cam (HSC; Miyazaki et al. 2018): Wide Imaging with Subaru Hyper Suprime-Cam Euclid Sky (WISHES) and Waterloo-Hawaii-IfA g-band Survey (WHIGS), respectively. In the southern hemisphere, imaging data in the griz bands are provided by the Dark Energy Survey (Abbott et al. 2018, 2021), as well as additional observations performed with the DECam instrument at the Blanco Telescope. For additional details on the survey design of Euclid, see Euclid Collaboration: Mellier et al. (2025).
The present work uses template-fitting photometry (TEMPLFIT) extracted using T-PHOT by the MER processing function (Euclid Collaboration: Romelli et al. 2026). Fluxes are computed by convolving the shape of the detected source in the VIS band with the corresponding PSF model at the different bands, and fitting the surface brightness profiles (see Euclid Collaboration: Merlin et al. 2023, for details). We apply a series of cuts to maximise the quality of the ugrizYEJEHE photometry:
-
VIS_DET = 1 (i.e. the source must be detected on the IE band);
-
FLAG_$BAND_TEMPLFIT< 4 (i.e. reject sources with saturated pixels or close to tile borders);
-
A homogeneous signal-to-noise ratio (S/N) threshold applied to ugrizYEJEHE bands, defined as FLUX_$BAND_TEMPLFIT/FLUXERR_$BAND_TEMPLFIT > 30, equivalent to Δmag ≈ 0.036;
-
SPURIOUS_FLAG = 0 (i.e. discard potential artefacts);
-
POINT_LIKE_PROB < 0.2 (i.e. remove misclassified stars).
See Euclid Collaboration: Romelli et al. (2026) for further details on the flags.
Additionally, we require the sources in our sample to have publicly available spectroscopy-based redshift estimates. In EDF-N, we cross-matched the sources with catalogues available from the DESI early data relase (DESI Collaboration 2024) and the Sloan Digital Sky Survey DR16 (Ahumada et al. 2020). The sample selected from the EDF-S and EDF-F fields results from a crossmatch with multiple spectroscopic campaigns: 2dFGRS (Colless et al. 2001); 2dFLenS (Blake et al. 2016); 3D-HST GOODs (Brammer et al. 2012); OzDES (Lidman et al. 2020); PRIMUS (Coil et al. 2011); and VVDS (Le Fèvre et al. 2013). We applied several additional quality assurance cuts to prevent outliers with unreliable photometry or spectroscopic redshift:
-
redshift cut: 0.001 < z < 1.3;
-
colour cut: 0 < g − r < 2;
-
absolute magnitude cut: −16 > Mr > −24.5.
The resulting sample comprises 9699 and 15 941 galaxies across the EDF-N and EDF-S+EDF-F fields, respectively. The northern sample is primarily composed of sources at 0 ≲ z ≲ 0.4, with red sequence galaxies dropping out at z ≳ 0.3. On the other hand, the EDF-S+EDF-F sample extends to higher redshifts, 0.2 ≲ z ≲ 0.8. Appendix A provides a discussion regarding the characterisation of the sample completeness and the statistical volume-correction applied to the sample in Sects. 4.5, 5.1, and 5.2.
2.2. IllustrisTNG
To test and validate our methodology, we build a synthetic sample using the IllustrisTNG simulations (Naiman et al. 2018; Marinacci et al. 2018; Springel et al. 2018; Pillepich et al. 2018a; Nelson et al. 2018). This suite comprises a series of cosmological magneto-hydrodynamical simulations, run with the moving-mesh AREPO code (Springel 2010), which model a vast range of physical processes such as gas cooling and heating, star-formation, stellar evolution and chemical enrichment, SN feedback, BH growth, or AGN feedback (see Weinberger et al. 2018; Pillepich et al. 2018b, for details). In this work, we use the publicly available results from the TNG100-1 run at z = 0, which consists of a cubic volume with a box length of about 107 Mpc, with dark matter and baryonic mass resolutions of 7.5 × 10⁶ M⊙ and 1.4 × 10⁶ M⊙, respectively. We select all non-flagged sub-haloes (i.e. rejecting those objects believed to be numerical artefacts) with total stellar mass within two effective radii, defined as the 3D comoving radius containing half of the stellar mass, in the range 109 < M*/M⊙ < 1012, comprising 18 367 sources.
For each simulated galaxy, we compute its star-formation history by accounting for all stellar particles located within two effective radii, defined in terms of the stellar component of each subhalo. The SFHs are used to predict observed-frame synthetic spectral energy distribution (SED) at redshift 0.0, 0.3, and 0.6 by means of the Population Synthesis Toolkit1 (PST, Corcho-Caballero et al. 2025, see also next section). Using the SFH obtained from the snapshot at z = 0 to compute the SED at prior times neglects the effects of mergers and accretion, which are not particularly relevant for our purposes (the SFHs are equally representative, and the number of galaxies between z = 0 and z = 0.6 changes up to 5%).
Particles are treated as simple stellar populations (SSPs), assuming a universal Kroupa (2001) initial mass function. In each redshift bin, their ages and metallicities are used to interpolate the SED templates, using a cloud-in-cell approach in terms of log(tage/yr) and log(Z*/Z⊙), from the PyPopStar SSP library (Millán-Irigoyen et al. 2021), which provides 106 models spanning 23 ages from 105 to 1.5 × 10¹⁰ yr and four metallicities Z* = {0.004, 0.008, 0.02, 0.05}. Particles whose values lie outside the grid are assigned the nearest corresponding value.
To make the mock sample more realistic, we adopt a Cardelli et al. (1989) dust extinction law with RV = 3.1. For each galaxy and redshift bin, the V-band magnitude extinction AV is sampled from an exponential probability distribution with a mean value of 0.3 mag, truncated at AV = 3. While this is an oversimplification, probably far from the intrinsic distribution of dust in galaxies, known to be dependent on fundamental quantities such as chemical composition and gas abundance (e.g., Li et al. 2019), our ultimate goal is to test the ability of our method to recover the input extinction together with the intrinsic SFH.
We computed fluxes in the ugrizYEJEHE bands by multiplying the synthetic spectra with the corresponding filter sensitivity curves2. For the sake of simplicity, only the effective throughputs of UNIONS filters corresponding to EDF-N data were used to produce the synthetic photometry. Finally, random Gaussian noise is added to the computed fluxes to model a S/N of 30, consistent with the minimum threshold imposed to the observational sample.
3. Characterising star-formation histories
3.1. Classification
In previous studies, quenched galaxies were identified using observational proxies for the specific star-formation rate, such as spectral features like EW(Hα) and Dn(4000), along with broad-band colours, which are sensitive to star formation on different timescales. In this work, we work directly with the average specific star-formation rate, sSFRlog(τ), computed over various timescales, τ, defined as:
 (1)
(1)
where SFR(t) denotes the instantaneous star-formation rate as function of cosmic time, and M*(t) represents the cumulative stellar mass formed in the galaxy, which is not exactly equal to the current stellar mass because of stellar mass loss. In other words, τ sSFRlog(τ) is the fraction of stellar mass formed in the last τ years. Note also that this description only takes into account the formation time of the stars and does not discriminate in situ star-formation from accretion in mergers.
While CC23a considered very short timescales (around 20 Myr) to capture the fraction of massive O and B stars responsible for Hα, broadband optical and infrared photometry has limited sensitivity to such young populations. Consequently, we adopt timescales of 100 Myr (sSFR8) and 1000 Myr (sSFR9) as fiducial values, providing a more robust framework for our analysis.
Figure 1 shows the distribution of IllustrisTNG galaxies in the sSFR8 versus sSFR9 plane, which serves as a basis for distinguishing between different evolutionary stages. This parameter space can be interpreted in terms of the existence of three domains: ageing galaxies, featuring a relatively stable star-formation activity across both timescales (roughly following a one-to-one relation); quenched galaxies, which have experienced a recent and rapid suppression of star-formation (i.e. very low levels of sSFR at present, while still showing significant star-forming activity over larger timescales); and retired systems, dominated by old stellar populations regardless of their star-formation history (i.e. both formerly ageing or quenched systems).
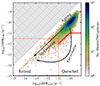 |
Fig. 1. Distribution of IllustrisTNG galaxies across the plane defined by the average specific star-formation measured over the last 108 (sSFR8) and 109 yr (sSFR9). Quenched galaxies are found below the solid red line, whereas the dotted line delimits the retired domain. Ageing systems are located above both regions. The grey-shaded area denotes the forbidden region of the parameter space. |
The classification criteria are defined as follows. Quenched galaxies (QGs) satisfy
 (2)
(2)
whereas retired galaxies meet the conditions
 (3)
(3)
and systems that do not fall into either of these categories are classified as ageing galaxies (AGs). This classification shares similarities with previous studies in the literature (e.g., Moutard et al. 2018; Quai et al. 2018; Owers et al. 2019; Belli et al. 2019; Cleland & McGee 2021; Tacchella et al. 2022; Corcho-Caballero et al. 2023b). For instance, compared to Moutard et al. (2018), most AGs correspond to the authors’ definition of ‘star-forming’ galaxies, QGs align with their ‘green-valley’ and ‘quiescent’ populations, and RGs are broadly consistent with their ‘old quiescent’ category (see Appendix C for a more detailed comparison). The key distinction between the two approaches lies in the definition of quenching. While Moutard et al. (2018) considers all transitions from star-forming to quiescent as (fast or slow) quenching, we interpret quenching as a specific process occurring under particular physical conditions in a short timescale, such as a mergers (e.g., Ellison et al. 2024), potentially triggering strong AGN kinetic feedback (e.g., Quai et al. 2021).
The division between retired galaxies and the other regions is set by the observational limit where specific star formation rates can be reliably measured. Retired galaxies exhibit extremely low sSFRlog(τ) values at both timescales, making it challenging to distinguish between systems that underwent quenching events more than 1 Gyr ago, and those that evolved purely in a secular fashion or under the influence of milder ‘regulating’ or ‘suppressing’ mechanisms. In the simulations, substituting the mass resolution into Eq. (3) yields the minimum stellar mass of an IllustrisTNG retired galaxy
 (4)
(4)
3.2. Bayesian inference of physical parameters
The values of sSFRlog(τ) of Illustris-TNG and Euclid galaxies are inferred from their synthetic and observed fluxes using BESTA3 (Bayesian Estimator for Stellar Population Analysis, Corcho-Caballero et al., in prep.), a Python-based Bayesian framework for deriving physical properties from observational data. BESTA integrates the PST (Population Synthesis Toolkit), and CosmoSIS4 (Cosmological Survey Inference System, Zuntz et al. 2015) libraries devoted for highly flexible stellar population synthesis, and Monte Carlo sampling techniques, respectively.
The PST library is designed to provide a user-friendly interface for working with simple stellar population (SSP) models and synthesizing a variety of observable quantities such as spectra or photometry from different prescriptions of the star-formation and chemical enrichment histories. On the other hand, CosmoSIS is a framework, originally devoted for cosmological parameter estimations, that brings together a wide diversity of Bayesian inference methods in a modular architecture.
We infer the values of sSFRlog(τ) by describing the star formation history of galaxies using a non-analytic model. The fraction of the total stellar mass formed by cosmic time t, denoted as  , where tobs is the age of the Universe at the time of observation, is parametrised as a monotonic piecewise function, with boundary conditions
  and
and  . This function is related to sSFRlog(τ) (Eq. (1)) by the expression
 (5)
(5)
During the sampling, Eq. (5) is evaluated at fixed lookback times τ ≡ tobs − t = 0.1, 0.3, 0.5, 1, 3, and 5 Gyr. The values of τ are chosen to roughly align with the age ranges where SSPs exhibit the largest differences in optical/IR colours (Millán-Irigoyen et al. 2021). The values of sSFRlog(τ) are sampled from a log-uniform prior distribution within − 14 < log10(sSFRlog(τ)/yr−1) < 1/τ, for each value of τ, rejecting solutions that do not yield a monotonically increasing  . For each sample of sSFRlog(τ), we estimate
  by interpolating the 8 points (six values of τ + boundary conditions) using a monotonic cubic spline5.
The chemical evolution of the stellar content of galaxies is modelled by assuming that the metallicity of stars formed at a given time, Z(t), is proportional to the mass growth history of the galaxy (e.g., Zibetti et al. 2017), following
 (6)
(6)
where Z(t0), the metallicity of stars formed at t0, is sampled using a uniform prior distribution between 0.25 < Z(t0)/Z⊙ < 4. For the sake of clarity, Eq. (6) is related to the mass-weighted average stellar metallicity, Z*, by the expression
 (7)
(7)
To build composite spectra and associated photometric fluxes resulting from the model described above,  and Z(t) are evaluated at the grid edges defined by the PyPopStar SSPs (Millán-Irigoyen et al. 2021, see Sect. 2.2 for more details). This allows us to estimate the relative contribution of each SSP,
  for any given SSP age and metallicity, and the resulting spectral energy distribution (SED), in units of specific luminosity per wavelength unit and stellar mass, is computed as
 (8)
(8)
where LSSP denotes the SSP model SEDs.
Dust extinction is included by assuming a single dust screen, using the Cardelli et al. (1989) extinction law with a fixed value of RV = 3.1. The extinction values given by AV, are also sampled from a uniform distribution ranging from 0 to 3.0 mag.
Finally, the predicted specific flux per frequency unit on each photometric band,  , is given by the expression
![Mathematical equation: $$ \begin{aligned} \hat{f}_{\nu , i}&= \frac{\int _0^{\infty } 10^{-0.4 \, A_V} \,F_{\lambda }\left[\lambda \, \left(1+z\right)^{-1}\right] \, S_{i}({\lambda }) \,{\lambda }\, \mathrm{d}{\lambda }}{\int _0^{\infty } \frac{3631 \mathrm{Jy}}{c\,{\lambda }} S_{i}({\lambda })\,\mathrm{d}{\lambda }}, \nonumber \\&\qquad F_{\lambda }\left[\lambda \, \left(1+z\right)^{-1}\right]=\frac{L_{\lambda }\left[\lambda \, \left(1+z\right)^{-1}\right]}{(1 + z)\,4\pi d_{\rm L}^2}, \end{aligned} $$](/articles/aa/full_html/2026/07/aa54582-25/aa54582-25-eq18.gif) (9)
(9)
where Si is the transmission function of the filter i, z is the source redshift, and dL is the luminosity distance evaluated at z.
Given a set of flux measurements, fν, i, and assuming Gaussian uncertainties, the log-likelihood associated with a given model can be computed as
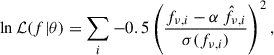 (10)
(10)
where θ denotes the vector of parameters used in the model, α is a normalisation constant between the observed and the predicted fluxes that corresponds to M*(t0), computed using the mean value of  , and σ(fν, i) represent the flux uncertainty estimates associated with each band i.
Given a prior, P(θ), Bayes’ theorem determines that the posterior probability distribution of a given model, P(θ|f), can be estimated as
 (11)
(11)
where the denominator denotes the Bayesian evidence, that for the purposes of this work can be simply treated as a proportionality constant.
To efficiently explore the posterior probability distribution, we use the max-like and emcee (Foreman-Mackey et al. 2013) samplers available in CosmoSIS. The former performs an initial minimisation of the problem, trying to locate the maximum of the posterior distribution, whereas the second sampler is a form of Monte-Carlo Markov chain that uses an ensemble of walkers to explore the parameter space. The resulting chain of parameters values are used to estimate the 9-dimensional posterior PDF via a Gaussian kernel density estimator (KDE) and derive the percentile values of sSFRlog(τ), Z(t0), AV, and M*(t0). The parameters used in the modelling of the observed photometry and associated priors are summarised in Table 1. The redshift is fixed to the spectroscopic measurement, and stellar masses are based on the ΛCDM luminosity distance. Note that the latter factor does not affect the sSFR.
Parameters used in BESTA for the SFH inference.
4. Results
4.1. Accuracy of the sSFR estimates
First, we utilise the results obtained from fitting IllustrisTNG synthetic photometry to benchmark the reliability of recovering the correct values of sSFRlog(τ). In order to minimise the impact of catastrophic outliers, we remove from our sample those galaxies with a poor fit quality. This is done by comparing the maximum value of the posterior probability distribution of each galaxy with the total distribution. We discard sources with values lower than the 5th percentile of the distribution (i.e. 5% of the total sample). Although no clear correlation is observed between the physical properties of the galaxy sample and the fit results, we find that fits fail more frequently for galaxies with high extinction (AV > 0.8).
The true input values of sSFRlog(τ) versus the median value recovered by BESTA are shown in Fig. 2, for the combined sample that includes the realisations at z = 0.0, 0.3, and 0.6 (see Appendix B for plots at each redshift bin). For any true value of sSFRlog(τ), the red lines denote the 5th, 50th, and 95th running percentiles of the median sSFRlog(τ) retrieved by BESTA, illustrating where the bulk of the distribution lies. Overall, the results are satisfactory across all timescales (τ), although we notice some systematic bias. For short timescales (top row panels), BESTA occasionally underestimates the true value of sSFRlog(τ), leading to an artificial population of galaxies with sSFR8/8.48 ≃ 10−14 yr−1. Conversely, when the true value is consistent with 0, i.e. no stellar particle was formed in the last τ Gyr (artificially set to sSFR = 10−15 yr−1 for visualisation purposes), the inferred median values typically stay close to the prior limit at 10−14 yr−1, but they also present an extended tail towards higher values of sSFRlog(τ) up to about 10−11 yr−1. This clearly highlights how difficult is to distinguish between strictly 0 and the ≃1% level in terms of the mass fraction formed over a given timescale using optical/IR photometry (e.g., Salvador-Rusiñol et al. 2020).
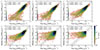 |
Fig. 2. IllustrisTNG sSFRlog(τ) true values versus the median value recovered by BESTA. Coloured maps denote the number of sources in each bin. Bottom to top red lines of every panel correspond to the running 5, 50, and 95 percentiles of sSFRlog(τ) as a function of the true value. Dashed and dotted black lines illustrate the one-to-one and 0.5 dex offset lines, respectively. Each panel includes at the top-right corner the fraction of sources whose true value lies within the 68 and 90% estimated credible intervals, respectively. |
At longer timescales (τ > 1 Gyr), BESTA tends to overestimate sSFRlog(τ) for values below 10−11 yr−1. The resulting median values typically lie in the range 10−12–10−10 yr−1, which corresponds to formed mass fractions of 0.003–0.3 and 0.005–0.5 at lookback times of 3 and 5 Gyr, respectively, in contrast to the true value of 0. In general, we observe that extreme outliers, i.e. that values significantly above/below the one-to-one line, primarily emerge as a consequence of over/under-estimating the dust extinction and/or metallicity by approximately ≳0.2 dex.
Given the intrinsic degeneracy between the parameters of our model, that may lead to an erroneous classification, it is of the utmost importance to not only rely on the median/mean/mode estimates of the resulting posterior PDF, but to make use of the whole distribution to account for the large uncertainties. To that end, Fig. 2 also includes the fraction of sources whose real value of sSFRlog(τ) lies within the 68 and 90% credible intervals estimated from the posterior PDF. This number depends on how well-calibrated the credible intervals are to the actual posterior probabilities and can be used as a proxy of the ability of the model to capture the complexity of the data. To estimate the fractions, only sources with sSFRlog(τ) > 10−14 yr−1 have been considered. As expected from a reasonably well-calibrated estimate of the uncertainties associated with sSFRlog(τ), both intervals properly account for ≃68% and ≃90% of the sample.
In Fig. 3, we show the ratio between the median value of the other physical properties included in the model – dust extinction, AV, stellar metallicity log10(Z*/Z⊙), and total stellar mass, log10(M*/M⊙) – and the true input value, for the three samples considered in this work (at z = 0, 0.3, and 0.6, respectively). The three quantities are roughly recovered by BESTA with a reasonable degree of accuracy (about 0.2 dex), although the biggest challenge is to effectively inferring AV. In a significant fraction of cases, AV is underestimated, resulting into an increase of the metallicity for compensating the change of colours. As a result of changing the mass-to-light ratio of the underlying stellar population, the final stellar mass estimate is also affected by a few percent. Nevertheless, the posterior probability distribution still seems to properly account for the intrinsic uncertainties as indicated by the fraction of sources within the 68 and 90 credible intervals.
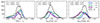 |
Fig. 3. Statistical distribution of the difference between the input IllustrisTNG values of dust extinction, AV, stellar metallicity, log10(Z*/Z⊙), and total stellar mass, log10(M*/M⊙), versus the median value recovered by BESTA. Each panel includes the fraction of sources whose true value lies within the 68 and 90% estimated credible intervals, respectively. |
It is worth remarking that the use of the median value is adopted only for its simplicity in terms of visualisation purposes. Throughout the remaining sections the goal is to make use of the entire posterior PDF in order to maximise the information content. In addition, it is also important to point out that our fitting procedure assumes the same basic ingredients (IMF, SSPs, extinction law) as the mock observations. This is of course an ideal case, and therefore our estimated uncertainties should be regarded as a lower limit (see e.g., Conroy 2013, for an exhaustive discussion).
4.2. Probabilistic AD classification
In this section we present our classification scheme mainly devoted for discriminating between slow (ageing) and fast (Quenching) evolution. Here, we describe the method based on analysing the posterior probability distribution of each galaxy. In contrast, Sect. 4.4 introduces an alternative, model-driven approach that maximises classification completeness and purity by leveraging the predictive power of the IllustrisTNG simulation.
We estimate the probability that a galaxy belongs to the ageing, quenched and retired populations (i) by integrating the marginalised posterior PDF, P(sSFR9, sSFR8|f), over the regions D(i) defined by the AD classification (described in Sect. 3.1), as specified by Eqs. (2) and (3)
 (12)
(12)
where the denominator represents the Bayesian evidence for the model, and P(i) indicates the probability of the galaxy being classified as ageing, quenched, or retired, and ∑P(i) = 1.
In Fig. 4 we show the purity and completeness fraction achieved when classifying the retired (left), quenched (middle), and ageing (right) populations by imposing a minimum probability threshold, Pmin, on the sample of IllustrisTNG galaxies. For each class, purity and completeness are defined as the number of true positives divided by the total number of observed (true and false) positives, NTP/(NTP + NFP), and the ratio between true positives divided by the number of true positives and false negatives, NTP/(NTP + NFN), respectively. To explore the effects of redshift on the performance of the classification, the sample has been split into the three redshift bins under consideration: z = 0.0, 0.3, and 0.6. Both ageing and retired populations are successfully classified with purity scores above 80% at all redshift bins. The completeness of both classes presents a stronger dependence with redshift. For a given probability threshold, retired galaxies tend to be more under-represented at higher values of z, whereas constraining the fraction of ageing systems at z ≃ 0 results more challenging than at high redshift.
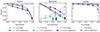 |
Fig. 4. Retired (left), quenched (middle), and ageing (right) galaxy classification purity and completeness, as a function of the minimum probability threshold used to perform the classification. Each redshift sample at z = 0, z = 0.3, and z = 0.6 is denoted by the blue, green, and purple lines, respectively. Coloured arrows denote the value of Pmin(Quenched) that maximises the F-score at each redshift (see Sect. 4.3). |
On the other hand, estimating the population of quenched galaxies presents more difficulties. At z = 0, the population of quenched galaxies is poorly identified, and it includes a significant number of false positives, that strongly limit the purity of the sample to ≃30% even when applying a threshold cut of Pmin(Quenched) > 0.75. When considering the same cut at higher values of z, this bias is significantly alleviated, and the sample purity increases to values between 50% and 75%. This is expected since optical photometry becomes more sensitive to the recent star-formation episodes due to the more prominent contribution of rest-frame UV light (mostly supported by young stellar populations).
4.3. Selection of quenched galaxies
In this section, we present two approaches for selecting recently quenched galaxies, each tailored to different priorities in classification performance. The first approach emphasises a balance between purity and completeness, achieved by selecting the probability threshold Pmin(Quenched) that maximises the F-score, defined as
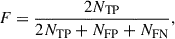 (13)
(13)
where NTP, NFP, NTN, and NFN represent the number of true positives, false positives, true negatives, and false negatives, respectively.
From the purity and completeness values shown in Fig. 4, we determine the optimal Pmin(Quenched) values for the samples at z = 0.0, 0.3, and 0.6 to be 0.63, 0.51, and 0.65, respectively. When combining the three redshift samples, the optimal threshold becomes Pmin(Quenched) = 0.65, yielding a combined purity of 37% and a completeness of 45%.
The second approach prioritises maximizing the purity of the quenched galaxy sample, even at the expense of low completeness. For this, we adopt a stricter threshold, Pmin(Quenched) = 0.95. This choice results in sample purities of 35%, 86%, and 76% at z = 0.0, 0.3, 0.60, respectively, with a combined purity fraction of 61%.
To evaluate the performance of these classification schemes, Fig. 5 displays the true (left) and median-based (right) distribution of IllustrisTNG galaxies across the sSFR9 versus sSFR8 plane. In the top row, all galaxies are colour-coded according to their probabilities of belonging to the retired, quenched, and ageing domains using an RGB palette.
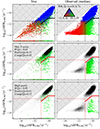 |
Fig. 5. Distribution of IllustrisTNG galaxies across the sSFR9 versus sSFR8 plane. Left and right columns show the distribution based on the true (null values of sSFR are arbitrarily set to log10(sSFR/yr−1) = −15) and inferred median values, respectively. Top row panels display the full sample RGB colour-coded by the probability of belonging to the retired, quenched, and ageing classes. Solid and dotted lines represent the demarcation lines given by Eqs. (2) and (3), respectively. Middle and bottom rows illustrate the two proposed approaches for selecting quenched galaxies (coloured points) by colouring in black with low transparency those systems classified as retired or ageing. |
The ‘balanced’ classification approach, which maximises the F-score, is illustrated in the middle row. Here, retired and ageing galaxies are shown in semi-transparent black to emphasise the spatial distribution of quenched systems. As can be readily seen, this method misclassifies a significant fraction of ageing systems located below the main sequence (MS) locus, roughly centred at log10(sSFR8, 9/yr−1) ≈ −10. In addition, there is also a small fraction (≃3%) of contaminants with very low values of sSFR9.
The classification that maximises sample purity is shown in the bottom row. This method significantly reduces contamination, with the remaining misclassified systems primarily consisting of ageing galaxies with moderate to low star-formation rates. Overall, the selected population of quenched galaxies is now dominated by systems with higher values of sSFR9, implying a more vigorous star-forming activity in the past compared to the current rate. These systems fall closer to the ‘post-starburst’ definition: galaxies with strong stellar Balmer absorption, due to the preponderance of A-type stars, and very little to null nebular emission, indicative of the demise of O- and B-type stars, implying a quenching event that truncated star-formation after the burst of star-formation. However, the biggest drawback of this classification is its low completeness, only reaching values close to 10%. Nevertheless, the vast cosmological volume probed by Euclid will alleviate this problem by providing an immense wealth of galaxies.
4.4. Model-driven classification
The classification method presented in the previous section relies on a marginalised version of the posterior, constrained to the space defined by sSFR9 and sSFR8. While this approach is appealing due to its simplicity and ease of interpretation, the full posterior, P(sSFRlog(τ) |f), contains significantly richer information that can be used to refine the classification. To this end, we have estimated the probability distribution, defined in terms of the 5th, 16th, 50th, 84th, and 95th percentiles of sSFRlog(τ), with log10(τ/yr) = {8.00, 8.48, 8.70, 9.00}, along with the correlation coefficients computed from the covariance matrix, ρ(sSFRτ1,sSFRτ2), for the population of ageing, quenched and retired galaxies, respectively. This distribution is more sensitive to subtle differences between the three populations, and can enhance the reliability of the classification.
To properly handle the 26-dimensional parameter space, denoted by the vector θ, we have used a Gaussian KDE. We denote the PDF associated with each AD class, i, as KDEi(θ). To classify individual objects, we compute the probability of the galaxy being drawn from the ageing, quenched, or retired distribution. The probability of belonging to each class is computed as
 (14)
(14)
The training process uses 80% of the total sample, randomly selected, while the remaining 20% forms the test sample to assess classification performance. The kernel bandwidth is optimised to maximise the mean classification score across all three classes and fixed to 0.38. Figure 6 presents the resulting purity and completeness scores for the test sample, demonstrating an improvement compared to the results in Fig. 4. For ageing and retired systems, purity and completeness exhibit reduced sensitivity to the threshold Pmin, and are systematically higher across all cuts. For quenched galaxies, the most significant improvement lies in the increase in purity across all redshift bins, nearly doubling for the z = 0 sample. However, completeness decreases consistently, falling below 30% for PKDE, min(Quenched) ≥ 0.5.
Figure 7 illustrates the application of the KDE-based classification method, analogous to Fig. 5. The number of false positives classified as quenched systems is significantly reduced, but this improvement comes at the cost of a smaller sample size and lower completeness. For the KDE method, the threshold PKDE, min(Quenched) = 0.16 maximises the F-score, achieving purity and completeness values of 36% and 53%, respectively, which is a marginal improvement over the criteria proposed earlier. However, as shown in the middle-row panels, many selected sources exhibit higher probabilities of being classified as ageing or retired systems.
On the other hand, this method excels the previous one when selecting a high-purity sample. A stricter cut of PKDE, min(Quenched) ≥ 0.7, shown in the bottom panels, achieves a purity of 77%, and completeness of 12%. This represents an improvement over the previous results, which yielded a purity and completeness of 61% and 13%, respectively.
While the KDE-based classification significantly enhances the identification of quenched systems, this improvement is strongly influenced by the training data. The classification depends on the star-formation histories of IllustrisTNG galaxies, the recipes used to generate the synthetic observables (PyPopStar, PST) and the recovery of physical properties using (BESTA). Careful validation is necessary when applying this method to other datasets to ensure its robustness.
4.5. Ageing and quenching in Euclid
Here we apply the classification methods described in the previous Sects. 4.2 and 4.4 to our sample of Euclid galaxies, based on the results inferred using BESTA (see Sect. 3.2). The distributions and fractions presented in this section arevolume-corrected, accounting for the sample selection effects described in Appendix A.
The top row of Fig. 8 illustrates the distribution of galaxies across the plane defined by their inferred (median) total stellar mass and sSFR8 across multiple redshift bins. The location of galaxies along the star-forming main sequence aligns reasonably well with previously reported values in the literature (e.g., Popesso et al. 2023) and the recent findings of Euclid Collaboration: Enia et al. (2026). In terms of mass completeness, dwarf galaxies with stellar masses below 109 M⊙ are detected only in the lowest redshift bin (z ≤ 0.1). Galaxies in the mass range (109 ≤ M*/M⊙ ≤ 1010) are observed up to redshift of approximately 0.4, while massive systems (M* ≥ 3 × 10¹⁰ M⊙) are detected over the whole redshift range.
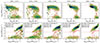 |
Fig. 8. Top: Distribution of Euclid galaxies across the stellar mass versus sSFR8 plane. The dotted line denotes the definition of the SFMS by Popesso et al. (2023). Bottom: Distribution of Euclid galaxies across the sSFR9 versus sSFR8 plane. The dotted and solid lines denote the retired and quenched domain demarcation lines, respectively. |
In terms of star-forming activity, galaxies with stellar masses above M* ≳ 1010.5 M⊙ generally exhibit very low sSFR8 values, often corresponding to upper limits. Conversely, the fraction of low-mass systems below the main sequence increases at lower redshifts.
The bottom row of Fig. 8 presents the distribution of galaxies across the sSFR9 versus sSFR8 plane. This parameter space offers a complementary view to the M*–sSFR8 plane, offering additional insights into the current evolutionary states of galaxies. A well-defined sequence of ageing galaxies is observed, characterised by roughly constant sSFR values over the past Gyr, ranging from 3 × 10⁻¹² to 10−9 yr−1, across all redshift bins. Additionally, a distinct population of quenched galaxies, recently detached from the ageing sequence, is detected. These two evolutionary pathways converge in the lower-left region of the diagram, forming a population of retired galaxies, with minimal star formation, whose light is completely dominated by old stellar populations.
The top-left corner of each panel indicates the volume-corrected fractions of ageing, quenched, and retired galaxies (see Fig. A.2 for details about the sample completeness in terms of RGs), labelled using the posterior and KDE-based classification schemes with cuts that maximise the F-score (see Sects. 4.3 and 4.4). The results from the two classifiers are consistent across all redshift bins. Ageing galaxies consistently dominate the population, representing over 70% in all bins. Quenched galaxies become increasingly prevalent at lower redshifts, while the fraction of retired systems grows from 8–10 up to 15–25%. However, these trends are also affected by sample selection effects, since low-mass quenched and retired galaxies become more difficult to detect at high z (see Sect. 5.1 for further discussion).
To contextualise these findings, we compare the fractions in the lowest redshift bin (0.01 < z < 0.1), where the sample is complete up to about 109 M⊙, with the results reported in CC23a. The authors estimated volume-corrected fractions of ageing, quenched, and retired galaxies, using both IllustrisTNG and the MaNGA survey (Bundy et al. 2015), based the EW(Hα) versus Dn(4000) ageing diagram. Table 2 summarises this comparison, listing the total fractions of these populations derived from the Euclid and IllustrisTNG samples (the latter using the realisation at z = 0). We computed the fractions with both the Bayesian posterior and KDE-based classifiers, employing three criteria: the minimum probability threshold (Pmin) that maximises the F-score; the threshold maximizing purity; and the label with the highest probability. This results in six fraction estimates for each sample.
Fractions of retired (RG), quenched (QG), and ageing (AG) galaxies at z < 0.1.
Additionally, we can qualitatively compare our results with the star-forming and ‘quiescent’6 fractions reported in Euclid Collaboration: Enia et al. (2026), based on the colour-based classification criteria from Williams et al. (2009) and Ilbert et al. (2013). For 0.2 < z < 0.5, 23% galaxies are classified as quiescent, and the reminder as star-forming. Our findings are in qualitative agreement, with QGs+RGs (AGs) making up 15–17% (82–84%) at 0.2 < z < 0.4, and 10–11% (88–89%) in the 0.4 < z < 0.6 bin. At higher redshifts (0.5 < z < 0.8), Euclid Collaboration: Enia et al. (2026) find a quiescent fraction of 15% (85 − 86% star-forming), whereas we estimate 6–7% QGs+RGs and 93% AGs, most likely driven by the lack of low-mass quenched and/or retired systems in our sample (as discussed in Appendix A, our fractions are only representative above 1011 M⊙ in this redshift bin; cf. Fig. 10 below).
As noted earlier, the two classifiers (Bayesian posterior and KDE) produce consistent results, with more pronounced differences arising between classification criteria, particularly for ageing and retired fractions. Overall, there is good qualitative agreement between this work and CC23a. However, when comparing results based on IllustrisTNG, the current analysis yields systematically higher fractions of ageing galaxies, while the fraction of quenched systems is reduced from 12% to 3%.
Beyond these methodological differences, selection effects and classification biases likely contribute to the observed discrepancies (see Sect. 4.2 for a detailed discussion). Despite these challenges, the comparison with observational data reveals significant agreement, with variations well within the expected systematic uncertainties.
5. Discussion
Understanding the formation mechanisms of galaxies dominated by old stellar populations, with little to no ongoing star formation, become a topic of considerable scientific interest in recent years (e.g., Casado et al. 2015; Quai et al. 2018; Owers et al. 2019; Corcho-Caballero et al. 2021b, 2023b). The detection of such systems at high redshift challenges widely accepted formation models, exposing potential limitations in our cosmological framework (e.g., Girelli et al. 2019; Merlin et al. 2019; Lovell et al. 2023; De Lucia et al. 2024; Lagos et al. 2025). The classification of galaxies into categories such as passive, quiescent, quenched, or, following the nomenclature proposed in Corcho-Caballero et al. (2021a, 2023a,b), retired (i.e. a heterogeneous population of galaxies influenced by secular, regulating, suppressing, and quenching processes), remains contentious. This reflects not only the complexity of the varied and intertwined processes that regulate (and potentially halt) star formation, but also the challenges of inferring such low levels of star formation from observational data.
Quiescent galaxies are often identified by imposing sSFR thresholds over specific timescales (Moustakas et al. 2013; Donnari et al. 2019; Tacchella et al. 2022), as well as cuts using proxies of sSFRlog(τ) such as broadband colours (e.g., Peng et al. 2010; Schawinski et al. 2014; Weaver et al. 2023). These thresholds are typically calibrated to isolate systems below the star-forming main sequence, with some incorporating redshift evolution (e.g., Tacchella et al. 2022). While this approach has provided valuable insights into galaxy evolution, such as trends in quiescent fractions and their dependence on stellar mass and environment (e.g., Peng et al. 2010; Donnari et al. 2019; Weaver et al. 2023), it often oversimplifies the transition to quiescence by focusing on single timescales and neglecting the diversity of star-formation histories.
To better understand the physical processes that regulate star formation, and quantify their relative contribution, one would need to use more sophisticated classifications than the usual quiescent versus star-forming scenario (e.g., Casado et al. 2015; Moutard et al. 2016, 2018; Quai et al. 2018; Owers et al. 2019; Iyer et al. 2020). In this work, we advocate for a more refined approach, that incorporates multiple timescales to classify galaxies based on their star-formation activity. This methodology captures better the diversity of evolutionary pathways, distinguishing between recently quenched systems and those that have been evolving secularly for longer periods of time.
The discussion is organised as follows. Section 5.1 investigates the dependence of galaxy populations on stellar mass in the Euclid and IllustrisTNG samples in the nearby Universe (z < 0.1). Section 5.2 explores the evolution of these populations across redshift, highlighting trends within different mass bins.
5.1. Ageing, quenched, and retired fractions at z < 0.1
This section examines the relationship between the fractions of galaxies classified as ageing, quenched, or retired see Sect. 3.1) and their total stellar mass. Additionally, we compare our classification methodology to the traditional threshold-based approach that relies on a single average value of sSFR.
Figure 9 presents the fraction of ageing, quenched, and retired galaxies as a function of stellar mass for nearby galaxies (z < 0.1) in the Euclid (left panels) and IllustrisTNG (right panels) samples. The top and bottom panels compare the two classification schemes outlined in Sects. 4.2 and 4.4, each optimised to maximise the F-score. In addition, we include the fractions of galaxies below the star-formation rate threshold of 10−11 yr−1 for sSFR8 and sSFR9 (solid and dashed black lines, respectively), and compare these with the results of CC21a (grey shaded region), derived from SDSS and GAMA surveys.
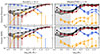 |
Fig. 9. Fraction of galaxies in different classes as function of total stellar mass. Blue, orange, and red lines denote the fraction of ageing, quenched, and retired galaxies, respectively. Solid and dashed black lines denote the fraction of galaxies with values of sSFR8 and sSFR9 below 10−11 yr−1. The grey-shaded region shows the fraction of galaxies with sSFR ≤ 10−11 yr (estimated using nebular emission lines and optical photometry) from CC21a. Top and bottom panels make use of the posterior- and KDE-based classification (see Sects. 4.2 and 4.4), respectively. Left panels show the fractions computed using a Euclid sample of nearby galaxies (z ≤ 0.1), where the grey-hatched area denotes the mass-completeness limit (see Appendix A). The error bars were estimated from 1000 random samples, each selecting 20% of the total sample and computing the 5 and 95 percentiles. Right panels show the results from the IllustrisTNG sample at z = 0, including the true values (square symbols), where the grey-hatched area denotes the retired mass resolution limit (see Sect. 3.1). |
The AD classification methods yield highly consistent fractions (coloured lines) for ageing and retired galaxies across both Euclid and IllustrisTNG datasets. However, the fraction of quenched galaxies shows greater sensitivity to the choice of classification method, though the overall trends with stellar mass remain qualitatively similar. In the simulated data (right panels), the true fractions for each class are also included (square symbols). As discussed earlier, the classification tends to slightly overestimate the fraction of quenched galaxies in IllustrisTNG, particularly at the high-mass end.
A comparison between the two datasets reveals some notable differences. In the IllustrisTNG sample, retired galaxies dominate at stellar masses ≥(2–3) × 1010 M⊙, comprising more than 75% of the population. Below this threshold, ageing galaxies dominate, also accounting for over 75% of the population, and the fraction remains nearly constant across these regimes. Observational data from Euclid, however, exhibits a smoother trend with stellar mass. The fraction of ageing galaxies decreases steadily from approximately 90% of the total sample at the low-mass end towards a negligible value at high masses. In contrast, retired galaxies show a monotonic increase, reaching around 90% for M#x002A; ≳ 1011 M⊙.
The fraction of quenched galaxies in Euclid remains approximately constant (10–20%) between 3 × 10⁹ to 1011 M⊙, beyond which the fraction drops to null values. The IllustrisTNG sample shows a more intricate structure: while a valley is evident at M* ≃ 1010 M⊙, an additional dip is observed at even higher stellar masses, around M* ≃ 3 × 10¹¹ M⊙. Note that, due numerical resolution effects (Sect. 2.2), the IllustrisTNG sample does not accurately probe the galaxy population below M* ≃ 5 × 10⁹ M⊙, but we do observe a clear difference between the simulated and observed populations for M* > 5 × 10⁹ M⊙. While most quiescent galaxies in Euclid are classified as quenched, they belong to the retired class in IllustrisTNG.
As previously discussed in CC23b, the choice of timescale for estimating the current star-formation rate significantly impacts the inferred fraction of passive galaxies. For example, when using a longer timescale (e.g., sSFR9), it yields a steadily increasing fraction of passive galaxies with stellar mass, closely matching the definition of retired galaxies. In contrast, shorter timescales such as sSFR8, result in a combined fraction that includes both quenched and retired populations, consistent with CC21a.
The observed flat distribution of quenched galaxies suggests that the quenching mechanism(s), responsible for shutting down star formation on timescales of ≃500 Myr (CC23a), are equally efficient at all stellar masses, across the range probed by the sample. Conversely, the population of retired galaxies is primarily populated by massive systems, dominating the fraction of galaxies above 3 × 10¹⁰ M⊙, which can be interpreted in terms of an increase in the impact of internal, and slow, ‘regulating’ or ‘suppression’ processes such as AGN thermal feedback, virial shock heating, but also enhanced star formation efficiency (Dekel & Birnboim 2006; Peng et al. 2010; Tortora et al. 2010, 2025). However, these interpretations remain qualitative. A larger sample, more rigorous selection, and expanded analysis are needed to refine these conclusions and further elucidate the physical mechanisms governing galaxy quenching. In summary, our classification provides a rich framework for studying and interpreting the evolutionary trends of galaxies in terms of their recent star-formation history.
5.2. Redshift evolution up to z = 0.8
Following the results of the previous section, here we examine the evolution of the fraction of each galaxy population as a function of redshift and stellar mass. Figure 10 illustrates the fraction of ageing (left), quenched (middle), and retired (right) galaxies as a function of redshift, divided in bins of stellar mass. The top and bottom rows display the results inferred using BESTA for Euclid and IllustrisTNG samples, including the fractions computed using the true labels of each IllustrisTNG galaxy. The fraction of galaxies in each domain has been computed using the probability estimated from the posterior, adopting the criteria that maximises the F-score. The results are rather insensitive to the choice of classifier (i.e. posterior- or KDE-based), presenting only a subtle change on the overall normalisation (see previous section). For the inferred fractions, we have computed qualitative estimates of the Poisson errors by bootstrapping the distribution selecting 1000 random samples and computing the 5th, 50th, and 95th percentiles of the resulting distribution.
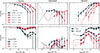 |
Fig. 10. Fraction of ageing, quenched, and retired galaxies as function of stellar mass in redshift bins. Each row of panels shows fractions inferred using BESTA for Euclid (top) and IllustrisTNG (middle) samples, along with true fractions from IllustrisTNG (squares). The error bars were estimated from 1000 random samples, each selecting 20% of the total sample and computing the 5 and 95 percentiles. In the top row, fractions for masses below the mass completeness limit (see Appendix A) are shown as dotted lines. Similarly, in IllustrisTNG, masses below the retired resolution limit are represented as dotted lines. |
In general, the fractions of ageing and retired galaxies exhibit growth and decline, respectively, with increasing z across all stellar mass ranges. Notably, in Euclid there is a strong correlation between the fraction of retired galaxies at a given redshift and stellar mass: more massive galaxies are significantly more likely to be in the retired domain compared to their lower-mass counterparts, in agreement with previous studies (e.g., Moutard et al. 2016). In IllustrisTNG we observe that, although still present, the correlation with stellar mass is more complicated. For example, in Fig. 10 the fraction of retired galaxies presents a redshift-independent maximum at 3–5 × 10¹⁰ M⊙, after which the fraction decays.
Regarding the growth of the retired population with cosmic time, we find that the simulation predicts a roughly mass-independent logarithmic increase for M* ≤ 5 × 10¹¹ M⊙, whereas in observational data, the fraction evolves more rapidly with decreasing stellar mass. At low stellar masses, the growth of the retired population proceeds more slowly in the simulation compared to observations. For Euclid massive galaxies with M* ≥ 3 × 10¹¹ M⊙, the retired population already comprised ≳40% of the total population at z ≃ 0.6. These findings are in qualitative agreement with the results presented in Euclid Collaboration: Cleland et al. (2026), where the authors studied the evolution of the fraction of passive galaxies as function of redshift and environment by using an time-dependent sSFR threshold7.
Conversely, the simulation suggests that for many massive galaxies, the transition from the ageing to the retired state, via ageing or Quenching evolutionary channels, occurs at later cosmic times, predominantly within the last 3–4 Gyr. This result is important as it might encode useful information for discriminating between the various physical processes responsible for regulating (or even quenching) star formation. For example, the relatively high fraction of massive retired galaxies at z ≳ 0.8 might support the idea of a merger-driven quenching scenario, while the simulation’s preferred quenching mechanism is AGN-driven feedback (Donnari et al. 2021), which also manifests in the presence of a ‘characteristic mass’ at ≃5 × 10¹⁰ M⊙. Nevertheless, potential bias that might drive differences between both samples are observational selection effects, but also numerical issues due to the reduced size of the simulation box (about 1003 Mpc3) and the backwards-modelling approach used to predict the fraction of IllustrisTNG galaxies at z > 0 (see Sect. 2.2).
Let us now focus on the evolution of the fraction of quenched galaxies. The population shows a weaker correlation with stellar mass with respect to the other two classes. The fraction of quenched galaxies remains relatively constant, around 0.02–0.08 in IllustrisTNG and 0.05–0.15 in Euclid. Building on the previous discussion, we find that in IllustrisTNG most of the quenching occurs at intermediate masses, around 5 × 10¹⁰ M⊙, strongly suggesting that Quenching is the primary formation channel of the retired population. In Euclid, the distribution is less pronounced but we still find hints of a mode that evolves with redshift (i.e. more massive galaxies are more likely to have undergone quenching at earlier times).
To improve this analysis, a more careful treatment of the sample selection, as well as a more complete sample, is required. Fortunately, future releases of Euclid will provide an unprecedented wealth of data, that will facilitate this endeavour.
5.3. Mass-size-metallicity relation
Figure 11 shows the distribution of the full sample of Euclid galaxies across the plane defined by their total stellar mass and effective radius, Re, used as a proxy for their physical size. The values of Re are derived from Sérsic surface brightness profile fits to VIS Euclid images (see Euclid Collaboration: Cropper et al. 2025; Euclid Collaboration: McCracken et al. 2026, for details on the instrument and data-reduction pipeline). In addition to their excellent spatial resolution, the wide spectral coverage of the IE band (5500–9000 Å) provides a robust estimate of galaxy size, being less sensitive to mass-to-light ratio variations compared to optical ugriz photometry. From left to right, the panels present the running 16th, 50th, and 84th percentiles of Re as function of stellar mass, M*, for retired, quenched, and ageing galaxies, respectively. The background colour maps shown in the top and bottom rows illustrate the median stellar metallicity (Z*) inferred by BESTA and IE-based Sérsic index (n), respectively, restricted to bins with at least 10 galaxies. To quantify the observed trends, we model the percentiles of Re(M*) using a ‘broken’ power-law model:
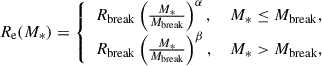 (15)
(15)
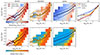 |
Fig. 11. Stellar mass size relation for the full sample of Euclid galaxies. From left to right, panels depict the distribution of retired, quenched, ageing, and the three combined classes across the parameter space. Solid and dashed lines denote the 16th, 50th, and 84th running percentiles computed using the Posterior- and KDE-based classifiers, respectively, adopting the criteria that maximises the F-score. The dotted dashed lines denotes the best-fit of Eq. (15) to the percentiles. Top and bottom coloured background maps illustrate the median value per bin of the inferred median stellar metallicity and Sérsic index, respectively, where only bins with more than ten galaxies have been considered. |
where Mbreak represents the characteristic mass where the logarithmic slope transitions between low-mass (α) and high-mass (β) regimes, and Rbreak the predicted effective radius at Mbreak. Figure 11 includes black dotted lines showing the best-fit models for each population percentile, with parameters summarised in Table 3. The rightmost panel compares the median relations across the three populations.
Retired galaxies exhibit the steepest correlation between Re and M*, maintaining consistent slopes (β ≃ 0.5–0.6) across percentiles. They also show systematically the highest values of n, aligning with previous results from the literature for early-type or bulge-dominated systems (e.g., Sánchez Almeida 2020). For M* ≳ 5 × 10¹⁰ M⊙, their distribution roughly follows a line of constant stellar surface density (Σ* ≃ 7 × 10³ M⊙ pc−2). Below this mass, the slope flattens (α ≃ 0.2), resembling the distribution of ageing galaxies. This turnover likely reflects a morphological transition from intermediate-mass red spirals to massive spheroidal systems.
The mass-size relation for ageing galaxies is flatter than that of retired galaxies across the whole mass range. Below (3–5)×1010 M⊙, the median Re is parallel to, but offset from, the retired population by a factor of about 1.6. Their extended size and low n indicates the presence of prominent discs, that allow ageing galaxies to sustain moderate-to-high levels of star-formation over large spatial (and temporal) scales. Above (3–5)×1010 M⊙, the slope steepens to approximately Re(M*)∝M*1/3, implying constant volumetric stellar density (ρ*) and characteristic time ( ).
).
Quenched galaxies occupy an intermediate position between the other populations. Below around 3 × 10¹⁰ M⊙, Re shows little dependence on mass (α = 0.04–0.013), with characteristic sizes of Re ∼ 1–1.6 kpc, indicating higher density and compactness (illustrated by the higher values of n) than ageing galaxies. At 3 × 10¹⁰ M⊙, the slope steepens (β = 0.36–0.47) bridging the trends of ageing and retired populations.
Stellar metallicity (Z*) complements our findings based on the morphology. Retired galaxies show uniformly high Z*, aligning with their compact morphology and dense stellar populations, tracing lines of constant Σ*. Ageing galaxies span a wide metallicity range. They are more chemically primitive at lower masses, but we observe a tighter correlation between Z* and Σ* than with M*. Quenched galaxies exhibit once again an intermediate behaviour, now in terms of chemical enrichment.
In CC23a and CC23b, galaxy quenching was identified as a ubiquitous yet rare process, predominantly affecting low-mass systems in relatively dense environments. Furthermore, CC23a highlighted that present-day quenched galaxies often exhibit evidence of preceding ‘starburst’ episodes before the cessation of star formation. Combined with their more compact morphologies and richer chemical compositions compared to ageing galaxies, these findings point to environmental quenching mechanisms (e.g., Wetzel et al. 2013), such as ram-pressure stripping, as the dominant mechanism for shutting down star-formation in the local Universe. The results of this work are consistent with these conclusions, further strengthening the observed links between morphological and chemical properties across the retired, quenched, and ageing galaxy populations. A natural extension of this analysis would be to apply our method separately to centrals and satellites at fixed stellar mass, potentially revealing distinct quenching timescales and underlying processes in the two populations.
6. Summary and conclusions
In this study, we have analysed the SFHs of a sample of galaxies from Euclid Q1 (Euclid Collaboration: Aussel et al. 2026) that span the redshift range 0 < z < 0.8. Building upon previous work by Corcho-Caballero et al. (2023a,b), we developed a probabilistic classification framework based on the inferred SFH that leveraged two estimates of the average specific star-formation rate (sSFRlog(τ)) measured over distinct timescales (τ = {108, 109} yr). This framework classifies galaxies into three evolutionary classes: ageing (undergoing slow evolution), quenched (recently halted star-formation due to a quenching episode), and retired (former ageing or quenched systems, currently dominated by old stellar populations with minimal star formation).
To test the limits of our classification scheme, we also generated synthetic observations of galaxies from the IllustrisTNG simulation at multiple redshifts. We inferred the SFHs by fitting optical-to-near-infrared photometry across ugrizYEJEHE bands using a Bayesian approach that captures the full posterior probability distribution (Sect. 3.2).
We introduced two classification methods:
-
Probabilistic classification: This estimates the likelihood of a galaxy belonging to each class by integrating the posterior probability distribution, in terms of sSFR8 and sSFR9, over the regions that delimit each class domain (Sect. 3.1).
-
Model-driven classification: Leveraging IllustrisTNG, this approach optimises sample purity and completeness for each class by exploring the parameter space including additional information from the posterior distribution (Sect. 4.4).
Applying these methods to the Euclid galaxy sample, we estimated the fractions of ageing, quenched, and retired galaxies at low redshift to be approximately 68–72%, 8–17%, and 14–19%, respectively. These findings align with the results of Corcho-Caballero et al. (2023b), which were based on spectroscopic data, suggesting that photometric classifications can achieve similar reliability.
We studied the fraction of ageing, quenched, and retired galaxies as a function of stellar mass. Our results suggest that, at the low mass-end, the number of quenched galaxies and retired systems is approximately the same. Conversely, the fraction of retired galaxies, which shows a smooth increasing function with stellar mass, exceeds the fraction of quenched systems by a significant factor at masses ≳3 × 10¹⁰ M⊙.
We then explored the evolution of the fraction of each class as a function of redshift in different stellar mass bins. As expected, the fraction of ageing galaxies increases with increasing redshift, whereas the fraction of retired objects presents a strong dependence on stellar mass and redshift: more massive systems become retired earlier as compared to their low-mass counterparts, in line with the ‘downsizing’ picture (Cowie et al. 1996) and the results reported in Euclid Collaboration: Enia et al. (2026). In contrast, the fraction of quenched galaxies shows mild trends with mass or redshift, and ranges between 5% and 15%. Our results show tentative evidence in favour of a scenario where more massive galaxies usually undergo quenching episodes at earlier times with respect to their low-mass counterparts.
We analysed the differences, in terms of the mass-size-metallicity relation, between ageing, quenched, and retired Euclid galaxies. Ageing galaxies are consistent with a population of late-type galaxies typically dominated by disc morphologies and low stellar metallicities. Retired objects follow a tight sequence in terms of stellar mass and effective radius that matches with that of early-type objects. Above M* ≃ 3 × 10¹⁰ M⊙, they arrange along a sequence consistent with constant stellar mass surface density (Σ* ≃ 7 × 10³ M⊙ pc−2). Finally, quenched galaxies appear as an intermediate population that is composed of relatively compact and more chemically evolved systems compared to their ageing counterparts at a given stellar mass. This characterisation of ageing, quenched, and retired galaxies is in excellent agreement with previous results from Corcho-Caballero et al. (2023a).
These results provide promising directions for understanding the physical mechanisms that drive quenching in galaxies. Nonetheless, the heterogeneous sample used in this work might suffer from selection effects and more careful selections are needed to extract more robust conclusions. Fortunately, our study represents a very small region of the sky (≈63 deg2) compared to the expected area surveyed by the Euclid mission (about 14 000 deg2). The combination of Euclid photometric data with either Euclid grism spectra and/or ancillary information will enable a far more comprehensive analysis, and underscores Euclid’s transformative potential in unravelling galaxy evolution on cosmological scales.
Acknowledgments
The Euclid Consortium acknowledges the European Space Agency and a number of agencies and institutes that have supported the development of Euclid, in particular the Agenzia Spaziale Italiana, the Austrian Forschungsförderungsgesellschaft funded through BMK, the Belgian Science Policy, the Canadian Euclid Consortium, the Deutsches Zentrum für Luft- und Raumfahrt, the DTU Space and the Niels Bohr Institute in Denmark, the French Centre National d’Etudes Spatiales, the Fundação para a Ciência e a Tecnologia, the Hungarian Academy of Sciences, the Ministerio de Ciencia, Innovación y Universidades, the National Aeronautics and Space Administration, the National Astronomical Observatory of Japan, the Netherlandse Onderzoekschool Voor Astronomie, the Norwegian Space Agency, the Research Council of Finland, the Romanian Space Agency, the State Secretariat for Education, Research, and Innovation (SERI) at the Swiss Space Office (SSO), and the United Kingdom Space Agency. A complete and detailed list is available on the Euclid web site (www.euclid-ec.org). Based on data from UNIONS, a scientific collaboration using three Hawaii-based telescopes: CFHT, Pan-STARRS and Subaru www.skysurvey.cc. Based on data from the Dark Energy Camera (DECam) on the Blanco 4-m Telescope at CTIO in Chile https://www.darkenergysurvey.org.
References
- Abbott, T. M. C., Abdalla, F. B., Allam, S., et al. 2018, ApJS, 239, 18 [Google Scholar]
- Abbott, T. M. C., Adamów, M., Aguena, M., et al. 2021, ApJS, 255, 20 [NASA ADS] [CrossRef] [Google Scholar]
- Abramson, L. E., Gladders, M. D., Dressler, A., et al. 2016, ApJ, 832, 7 [NASA ADS] [CrossRef] [Google Scholar]
- Ahumada, R., Allende Prieto, C., Almeida, A., et al. 2020, ApJS, 249, 3 [NASA ADS] [CrossRef] [Google Scholar]
- Arnouts, S., Le Floc’h, E., Chevallard, J., et al. 2013, A&A, 558, A67 [NASA ADS] [CrossRef] [EDP Sciences] [Google Scholar]
- Aufort, G., Laigle, C., McCracken, H. J., et al. 2025, A&A, 699, A328 [NASA ADS] [CrossRef] [EDP Sciences] [Google Scholar]
- Baldry, I. K., Driver, S. P., Loveday, J., et al. 2012, MNRAS, 421, 621 [NASA ADS] [Google Scholar]
- Belli, S., Newman, A. B., & Ellis, R. S. 2019, ApJ, 874, 17 [Google Scholar]
- Bialas, D., Lisker, T., Olczak, C., Spurzem, R., & Kotulla, R. 2015, A&A, 576, A103 [NASA ADS] [CrossRef] [EDP Sciences] [Google Scholar]
- Bigiel, F., Leroy, A., Walter, F., et al. 2008, AJ, 136, 2846 [NASA ADS] [CrossRef] [Google Scholar]
- Blake, C., Amon, A., Childress, M., et al. 2016, MNRAS, 462, 4240 [NASA ADS] [CrossRef] [Google Scholar]
- Booth, C. M., & Schaye, J. 2009, MNRAS, 398, 53 [Google Scholar]
- Boselli, A., & Gavazzi, G. 2006, PASP, 118, 517 [Google Scholar]
- Bouché, N., Dekel, A., Genzel, R., et al. 2010, ApJ, 718, 1001 [Google Scholar]
- Brammer, G. B., van Dokkum, P. G., Franx, M., et al. 2012, ApJS, 200, 13 [Google Scholar]
- Brown, T., Catinella, B., Cortese, L., et al. 2017, MNRAS, 466, 1275 [Google Scholar]
- Bundy, K., Bershady, M. A., Law, D. R., et al. 2015, ApJ, 798, 7 [Google Scholar]
- Cardelli, J. A., Clayton, G. C., & Mathis, J. S. 1989, ApJ, 345, 245 [Google Scholar]
- Casado, J., Ascasibar, Y., Gavilán, M., et al. 2015, MNRAS, 451, 888 [NASA ADS] [CrossRef] [Google Scholar]
- Chambers, K. C., Magnier, E. A., Metcalfe, N., et al. 2016, arXiv e-prints [arXiv:1612.05560] [Google Scholar]
- Cheung, E., Bundy, K., Cappellari, M., et al. 2016, Nature, 533, 504 [NASA ADS] [CrossRef] [Google Scholar]
- Cleland, C., & McGee, S. L. 2021, MNRAS, 500, 590 [Google Scholar]
- Coil, A. L., Blanton, M. R., Burles, S. M., et al. 2011, ApJ, 741, 8 [Google Scholar]
- Colless, M., Dalton, G., Maddox, S., et al. 2001, MNRAS, 328, 1039 [Google Scholar]
- Conroy, C. 2013, ARA&A, 51, 393 [NASA ADS] [CrossRef] [Google Scholar]
- Corcho-Caballero, P., Casado, J., Ascasibar, Y., & García-Benito, R. 2021a, MNRAS, 507, 5477 [NASA ADS] [CrossRef] [Google Scholar]
- Corcho-Caballero, P., Ascasibar, Y., & Scannapieco, C. 2021b, MNRAS, 506, 5108 [NASA ADS] [CrossRef] [Google Scholar]
- Corcho-Caballero, P., Ascasibar, Y., Cortese, L., et al. 2023a, MNRAS, 524, 3692 [Google Scholar]
- Corcho-Caballero, P., Ascasibar, Y., Sánchez, S. F., & López-Sánchez, Á. R. 2023b, MNRAS, 520, 193 [NASA ADS] [CrossRef] [Google Scholar]
- Corcho-Caballero, P., Ascasibar, Y., & Jiménez-López, D. 2025, J. Open Source Softw., 10, 8203 [Google Scholar]
- Cowie, L. L., Songaila, A., Hu, E. M., & Cohen, J. G. 1996, AJ, 112, 839 [Google Scholar]
- Crenshaw, D. M., Kraemer, S. B., & George, I. M. 2003, ARA&A, 41, 117 [NASA ADS] [CrossRef] [Google Scholar]
- Croton, D. J., Springel, V., White, S. D. M., et al. 2006, MNRAS, 365, 11 [Google Scholar]
- De Lucia, G., Weinmann, S., Poggianti, B. M., Aragón-Salamanca, A., & Zaritsky, D. 2012, MNRAS, 423, 1277 [NASA ADS] [CrossRef] [Google Scholar]
- De Lucia, G., Fontanot, F., Xie, L., & Hirschmann, M. 2024, A&A, 687, A68 [NASA ADS] [CrossRef] [EDP Sciences] [Google Scholar]
- Dekel, A., & Birnboim, Y. 2006, MNRAS, 368, 2 [NASA ADS] [CrossRef] [Google Scholar]
- DESI Collaboration (Adame, A. G., et al.) 2024, AJ, 168, 58 [NASA ADS] [CrossRef] [Google Scholar]
- Di Matteo, T., Springel, V., & Hernquist, L. 2005, Nature, 433, 604 [NASA ADS] [CrossRef] [Google Scholar]
- Donnari, M., Pillepich, A., Nelson, D., et al. 2019, MNRAS, 485, 4817 [Google Scholar]
- Donnari, M., Pillepich, A., Joshi, G. D., et al. 2021, MNRAS, 500, 4004 [Google Scholar]
- Ellison, S., Ferreira, L., Wild, V., et al. 2024, Open J. Astrophys., 7, 121 [Google Scholar]
- Euclid Collaboration (Scaramella, R., et al.) 2022, A&A, 662, A112 [NASA ADS] [CrossRef] [EDP Sciences] [Google Scholar]
- Euclid Collaboration (Bisigello, L., et al.) 2023, MNRAS, 520, 3529 [NASA ADS] [CrossRef] [Google Scholar]
- Euclid Collaboration (Merlin, E., et al.) 2023, A&A, 671, A101 [Google Scholar]
- Euclid Collaboration (Enia, A., et al.) 2024, A&A, 691, A175 [NASA ADS] [Google Scholar]
- Euclid Collaboration (Abdurro’uf, et al.) 2025, A&A, 702, A72 [Google Scholar]
- Euclid Collaboration (Cropper, M., et al.) 2025, A&A, 697, A2 [Google Scholar]
- Euclid Collaboration (Jahnke, K., et al.) 2025, A&A, 697, A3 [Google Scholar]
- Euclid Collaboration (Mellier, Y., et al.) 2025, A&A, 697, A1 [Google Scholar]
- Euclid Collaboration (Aussel, H., et al.) 2026, A&A, 711, A1 (Euclid Q1 SI) [Google Scholar]
- Euclid Collaboration (Cleland, C., et al.) 2026, A&A, in press, https://doi.org/10.1051/0004-6361/202554581 [Google Scholar]
- Euclid Collaboration (Enia, A., et al.) 2026, A&A, 711, A14 (Euclid Q1 SI) [Google Scholar]
- Euclid Collaboration (McCracken, H. J., et al.) 2026, A&A, 711, A2 (Euclid Q1 SI) [Google Scholar]
- Euclid Collaboration (Romelli, E., et al.) 2026, A&A, 711, A4 (Euclid Q1 SI) [Google Scholar]
- Faber, S. M., Willmer, C. N. A., Wolf, C., et al. 2007, ApJ, 665, 265 [Google Scholar]
- Favole, G., Gonzalez-Perez, V., Ascasibar, Y., et al. 2024, A&A, 683, A46 [NASA ADS] [CrossRef] [EDP Sciences] [Google Scholar]
- Fitts, A., Boylan-Kolchin, M., Elbert, O. D., et al. 2017, MNRAS, 471, 3547 [NASA ADS] [CrossRef] [Google Scholar]
- Foreman-Mackey, D., Hogg, D. W., Lang, D., & Goodman, J. 2013, PASP, 125, 306 [Google Scholar]
- Gensior, J., Kruijssen, J. M. D., & Keller, B. W. 2020, MNRAS, 495, 199 [NASA ADS] [CrossRef] [Google Scholar]
- Girelli, G., Bolzonella, M., & Cimatti, A. 2019, A&A, 632, A80 [NASA ADS] [CrossRef] [EDP Sciences] [Google Scholar]
- Gunn, J. E., Gott, J., & Richard, I. 1972, ApJ, 176, 1 [Google Scholar]
- Hopkins, P. F., Quataert, E., & Murray, N. 2012, MNRAS, 421, 3522 [Google Scholar]
- Ilbert, O., McCracken, H. J., Le Fèvre, O., et al. 2013, A&A, 556, A55 [NASA ADS] [CrossRef] [EDP Sciences] [Google Scholar]
- Iyer, K. G., Tacchella, S., Genel, S., et al. 2020, MNRAS, 498, 430 [NASA ADS] [CrossRef] [Google Scholar]
- Jiménez-López, D., Corcho-Caballero, P., Zamora, S., & Ascasibar, Y. 2022, A&A, 662, A1 [NASA ADS] [CrossRef] [EDP Sciences] [Google Scholar]
- Kormendy, J., & Kennicutt, R. C., Jr 2004, ARA&A, 42, 603 [NASA ADS] [CrossRef] [Google Scholar]
- Kroupa, P. 2001, MNRAS, 322, 231 [NASA ADS] [CrossRef] [Google Scholar]
- Lagos, C. d. P., Valentino, F., Wright, R. J., et al. 2025, MNRAS, 536, 2324 [Google Scholar]
- Larson, R. B., Tinsley, B. M., & Caldwell, C. N. 1980, ApJ, 237, 692 [Google Scholar]
- Le Fèvre, O., Cassata, P., Cucciati, O., et al. 2013, A&A, 559, A14 [Google Scholar]
- Li, Q., Narayanan, D., & Davé, R. 2019, MNRAS, 490, 1425 [CrossRef] [Google Scholar]
- Lidman, C., Tucker, B. E., Davis, T. M., et al. 2020, MNRAS, 496, 19 [NASA ADS] [CrossRef] [Google Scholar]
- Lovell, C. C., Roper, W., Vijayan, A. P., et al. 2023, MNRAS, 525, 5520 [NASA ADS] [Google Scholar]
- Maiolino, R., & Mannucci, F. 2019, A&ARv, 27, 3 [Google Scholar]
- Marinacci, F., Vogelsberger, M., Pakmor, R., et al. 2018, MNRAS, 480, 5113 [NASA ADS] [Google Scholar]
- Martig, M., Bournaud, F., Teyssier, R., & Dekel, A. 2009, ApJ, 707, 250 [Google Scholar]
- Martin, D. C., Fanson, J., Schiminovich, D., et al. 2005, ApJ, 619, L1 [Google Scholar]
- Martin, D. C., Gonçalves, T. S., Darvish, B., Seibert, M., & Schiminovich, D. 2017, ApJ, 842, 20 [Google Scholar]
- Merlin, E., Fontana, A., Castellano, M., et al. 2018, MNRAS, 473, 2098 [Google Scholar]
- Merlin, E., Fortuni, F., Torelli, M., et al. 2019, MNRAS, 490, 3309 [CrossRef] [Google Scholar]
- Millán-Irigoyen, I., Mollá, M., Cerviño, M., et al. 2021, MNRAS, 506, 4781 [CrossRef] [Google Scholar]
- Miyazaki, S., Komiyama, Y., Kawanomoto, S., et al. 2018, PASJ, 70, S1 [NASA ADS] [Google Scholar]
- Moore, B., Katz, N., Lake, G., Dressler, A., & Oemler, A. 1996, Nature, 379, 613 [Google Scholar]
- Moustakas, J., Coil, A. L., Aird, J., et al. 2013, ApJ, 767, 50 [NASA ADS] [CrossRef] [Google Scholar]
- Moutard, T., Arnouts, S., Ilbert, O., et al. 2016, A&A, 590, A103 [NASA ADS] [CrossRef] [EDP Sciences] [Google Scholar]
- Moutard, T., Sawicki, M., Arnouts, S., et al. 2018, MNRAS, 479, 2147 [NASA ADS] [CrossRef] [Google Scholar]
- Moutard, T., Malavasi, N., Sawicki, M., Arnouts, S., & Tripathi, S. 2020, MNRAS, 495, 4237 [CrossRef] [Google Scholar]
- Naiman, J. P., Pillepich, A., Springel, V., et al. 2018, MNRAS, 477, 1206 [Google Scholar]
- Nelson, D., Pillepich, A., Springel, V., et al. 2018, MNRAS, 475, 624 [Google Scholar]
- Owers, M. S., Hudson, M. J., Oman, K. A., et al. 2019, ApJ, 873, 52 [Google Scholar]
- Peng, Y.-J., Lilly, S. J., Kovač, K., et al. 2010, ApJ, 721, 193 [Google Scholar]
- Peng, Y., Maiolino, R., & Cochrane, R. 2015, Nature, 521, 192 [Google Scholar]
- Pillepich, A., Nelson, D., Hernquist, L., et al. 2018a, MNRAS, 475, 648 [Google Scholar]
- Pillepich, A., Springel, V., Nelson, D., et al. 2018b, MNRAS, 473, 4077 [Google Scholar]
- Popesso, P., Concas, A., Cresci, G., et al. 2023, MNRAS, 519, 1526 [Google Scholar]
- Quai, S., Pozzetti, L., Citro, A., Moresco, M., & Cimatti, A. 2018, MNRAS, 478, 3335 [Google Scholar]
- Quai, S., Hani, M. H., Ellison, S. L., Patton, D. R., & Woo, J. 2021, MNRAS, 504, 1888 [NASA ADS] [CrossRef] [Google Scholar]
- Salvador-Rusiñol, N., Vazdekis, A., La Barbera, F., et al. 2020, Nat. Astron., 4, 252 [CrossRef] [Google Scholar]
- Sánchez Almeida, J. 2020, MNRAS, 495, 78 [Google Scholar]
- Sawala, T., Scannapieco, C., Maio, U., & White, S. 2010, MNRAS, 402, 1599 [Google Scholar]
- Schawinski, K., Urry, C. M., Simmons, B. D., et al. 2014, MNRAS, 440, 889 [Google Scholar]
- Schmidt, M. 1968, ApJ, 151, 393 [Google Scholar]
- Skrutskie, M. F., Cutri, R. M., Stiening, R., et al. 2006, AJ, 131, 1163 [NASA ADS] [CrossRef] [Google Scholar]
- Springel, V. 2010, MNRAS, 401, 791 [Google Scholar]
- Springel, V., Pakmor, R., Pillepich, A., et al. 2018, MNRAS, 475, 676 [Google Scholar]
- Tacchella, S., Dekel, A., Carollo, C. M., et al. 2016, MNRAS, 457, 2790 [Google Scholar]
- Tacchella, S., Conroy, C., Faber, S. M., et al. 2022, ApJ, 926, 134 [NASA ADS] [CrossRef] [Google Scholar]
- Tortora, C., Napolitano, N. R., Cardone, V. F., et al. 2010, MNRAS, 407, 144 [Google Scholar]
- Tortora, C., Busillo, V., Napolitano, N. R., et al. 2025, A&A, 702, A177 [NASA ADS] [CrossRef] [EDP Sciences] [Google Scholar]
- Walters, D., Woo, J., & Ellison, S. L. 2022, MNRAS, 511, 6126 [NASA ADS] [CrossRef] [Google Scholar]
- Weaver, J. R., Davidzon, I., Toft, S., et al. 2023, A&A, 677, A184 [NASA ADS] [CrossRef] [EDP Sciences] [Google Scholar]
- Weibel, A., Wang, E., & Lilly, S. J. 2023, ApJ, 950, 102 [Google Scholar]
- Weinberger, R., Springel, V., Pakmor, R., et al. 2018, MNRAS, 479, 4056 [Google Scholar]
- Wetzel, A. R., Tinker, J. L., Conroy, C., & van den Bosch, F. C. 2013, MNRAS, 432, 336 [Google Scholar]
- Williams, R. J., Quadri, R. F., Franx, M., van Dokkum, P., & Labbé, I. 2009, ApJ, 691, 1879 [NASA ADS] [CrossRef] [Google Scholar]
- Wright, R. J., Lagos, C. d. P., Davies, L. J. M., et al. 2019, MNRAS, 487, 3740 [NASA ADS] [CrossRef] [Google Scholar]
- Zibetti, S., Gallazzi, A. R., Ascasibar, Y., et al. 2017, MNRAS, 468, 1902 [NASA ADS] [Google Scholar]
- Zuntz, J., Paterno, M., Jennings, E., et al. 2015, Astron. Comput., 12, 45 [NASA ADS] [CrossRef] [Google Scholar]
Available through the Spanish Virtual Observatory Filter profile service at http://svo2.cab.inta-csic.es/theory/fps/
The monotonic Piecewise Cubic Hermite Interpolating Polynomial (PCHIP) implemented in scipy.
Note that their definition of quiescent galaxies differs from ours; their quiescent population broadly corresponds to our QGs+RGs category.
Note that their definition of passive completely encompasses both quenched and retired galaxies, as well as the a fraction of ageing systems with mild star-formation levels.
Appendix A: Sample completeness and volume corrections
This appendix details the methodology used to assess the completeness of our sample and apply volume corrections to account for selection effects. Our approach follows the procedure outlined in Favole et al. (2024).
For each spectroscopic survey contributing to our sample, we estimate the maximum distance at which a galaxy would be detected by considering both a filter-dependent flux limit and the imposed signal-to-noise ratio (S/N) threshold.
To determine the maximum apparent magnitude, mlim, for each photometric band in each survey, we compute the 95th percentile of the apparent magnitude in redshift bins. The final mlim is obtained as the median of these percentiles. Table A.1 summarises the magnitude limits for each survey.
Adopted apparent magnitude flux limit per survey and photometric band.
Galaxies with apparent magnitudes fainter than these limits are discarded. The maximum distance at which a source would still be detected in each band is then given by the maximum distance modulus μ(zlim), at which a source would be detected on each band as
 (A.1)
(A.1)
where M is the absolute magnitude and K(zlim) is the K-correction at the maximum redshift. The values of K(z) for each source are estimated from the photometric properties of the stellar populations inferred using BESTA (see Sect. 3.2).
We also account for the selection based on S/N by computing the minimum detectable flux for a given noise level
 (A.2)
(A.2)
which translates into a limiting apparent magnitude
 (A.3)
(A.3)
By combining this with Eq. (A.1), we estimate a second maximum detection distance.
For each galaxy in our sample, we compute two maximum redshifts for each available photometric band, with the final limiting redshift, zmax, taken as the minimum value across all bands. To estimate the statistical contribution of galaxies in a given redshift bin (zlow, zup), we use the 1/Vmax formalism (Schmidt 1968)
![Mathematical equation: $$ \begin{aligned} V_{\rm max} = \frac{A}{3} \left(d_{\rm L}[\mathrm{min}(z_{\rm max}, z_{\rm up})]^3 - d_{\rm L}[z_{\rm low}]^3\right), \end{aligned} $$](/articles/aa/full_html/2026/07/aa54582-25/aa54582-25-eq30.gif) (A.4)
(A.4)
where A is the survey area in steradians and dL(z) is the luminosity distance.
Since our primary interest lies in the relative contributions of different galaxy populations rather than their absolute number densities, we normalise the survey areas relative to the stellar mass function from Baldry et al. (2012). The resulting stellar mass functions in various redshift bins, derived from individual surveys (coloured lines) and the combined dataset (black dashed lines), are shown in Fig. A.1.
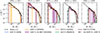 |
Fig. A.1. Stellar mass function in different redshift bins. To account for the different effective areas of the surveys, the distributions are normalised between the mass limits of 3 × 10¹⁰ M⊙, and 1012 M⊙. Dashed lines denote the double-Schechter fit (restricted to z ≤ 0.06) from Baldry et al. (2012). Coloured lines denote the resulting mass function from the different surveys that compose the sample. Black dashed-dotted illustrate the resulting mass function of the total sample. |
Although the Vmax correction accounts for selection effects, it remains effective only if a fraction of the missing galaxy population is still detectable. Figure A.2 illustrates the completeness limits for quenched and retired galaxies as a function of redshift and stellar mass.
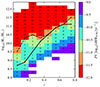 |
Fig. A.2. Completeness of retired galaxies in terms of z, and M*. The coloured map illustrates the 5th percentile of sSFR9 on each z–M* bin. Each bin includes the (uncorrected) fraction of retired galaxies with respect to the total, based on the classification that maximises the F-score. The dashed and solid lines denote the mass completeness limit above which retired galaxies are detected. Each line tracks the lower envelope that satisfies sSFR9 < 10−11 yr−1 and sSFR8 < 3 × 10⁻¹¹ yr−1, based on the 5th and 1st percentiles, respectively. |
These limits are estimated using the 5th percentile and the minimum value of sSFR8 and sSFR9 in each redshift–stellar mass bin. The bottom panel of Figure A.2 provides an absolute detection limit for each galaxy class, indicating the regime where volume corrections are still valid. The top panel presents a more conservative threshold.
Appendix B: SFH inference performance as function of redshift
In this appendix, we present the results obtained from fitting the IllustrisTNG ugrizYEJEHE photometry with BESTA as function of their observed redshift. Figures B.1, B.2, and B.3 show the true input values of sSFRlog(τ) versus the median value recovered by BESTA for the realisations at z = 0.0, 0.3, and 0.6, respectively, complementing Fig. 2.
The effect of redshifting the SED of our sample of galaxies has a significant impact on the performance of the recovery of the values of sSFRlog(τ). From z = 0 to z = 0.6, we find a progressive improvement in the performance of the fits illustrated by the reduction of the scatter along the one-to-one line. The number of catastrophic outliers also seems to decrease, especially for τ ≥ 109 yr. On the other hand, the fraction of sources whose input value of sSFRlog(τ) is within the 68 and 90% credible intervals decreases in most of the cases with respect to the realisation at z = 0, implying that the estimate of the posterior probability distribution might be too sharp and the uncertainties are underestimated.
Appendix C: Comparison with alternative classification schemes
In this appendix, we present a direct comparison between our classification scheme (Sect. 3.1) and the one proposed by Moutard et al. (2018), which is based on the rest-frame (NUV − r) versus (r − Ks) colour-colour diagram (hereafter NUVrK; see also Arnouts et al. 2013; Moutard et al. 2016). The NUVrK plane is used to distinguish between three primary galaxy populations – “star-forming” (SF), “green-valley” (GV), and “quiescent” (Q) – with each group further subdivided into “young” (Y) or “old” (O) categories based on their r − Ks colour, yielding six distinct classes.
To enable a direct comparison, we use synthetic rest-frame photometry from the IllustrisTNG simulation at z = 0, using the CFHT r band alongside GALEX NUV (Martin et al. 2005) and 2MASS Ks (Skrutskie et al. 2006) filters. The left panel of Fig. C.1 shows the distribution of our ageing (blue), quenched (green), and retired (red) galaxies across the NUVrK diagram. Black lines indicate the demarcation criteria from Moutard et al. (2018).
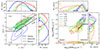 |
Fig. C.1. Left: Distribution of IllustrisTNG galaxies across the NUVrK colour-colour diagram, coloured according to the classification defined in Sect. 3.1; contours enclosing 68% and 95% of the ageing and retired galaxies are displayed as red and blue lines, respectively, whereas the quenched population is also highlighted by a green shaded area. Black lines indicate the demarcation criteria adopted by Moutard et al. (2018). Vertical and horizontal histograms show the marginal distributions of each class in terms of (NUV − r) and (r − Ks), respectively. Right: Same galaxy sample shown in the sSFR8 versus sSFR9 plane, with colours corresponding to the six-class scheme of Moutard et al. (2018); young (Y) / old (O), quiescent (Q) / green valley (GV) / and star-forming (SF). The yellow shaded area highlights the young quiescent (Y-Q) population. Vertical and horizontal histograms indicate the marginal distributions in sSFR8 and sSFR9, respectively. |
In this diagram, retired galaxies predominantly lie above the quiescent boundary and are most frequently classified as “old quiescent” (84%). Ageing galaxies are mainly located within the star-forming region and are typically labelled as “young star-forming” (67%), although a notable fraction (13%) extends into the green-valley regime. Quenched galaxies span both the GV and quiescent regions, with a broad range in r − Ks colour: 16% are classified as Y-GV, 15% as O-GV, as 33% Y-Q, and 36% as O-Q. Notably, the number of quenched galaxies dominates over retired systems in the range r − Ks ≲ 0.5.
The right panel of Fig. C.1 presents the distribution of the six NUVrK-based classes across the sSFR8 versus sSFR9 plane used in our classification. The ageing domain encompasses the entirety of the SF population (both Y and O), the majority of GV galaxies (94% of Y-GV and 70% of O-GV), and small subset of the quiescent class (6% of Y-Q and 1% of O-Q). The quenched region contains 5%, 8%, 15%, and 3% of the Y-GV, O-GV, Y-Q, and O-Q populations, respectively. Finally, the retired domain includes 1% of Y-GV, 22% of O-GV, 79% of Y-Q, and 96% of O-Q galaxies.
All Tables
All Figures
|
Fig. 1. Distribution of IllustrisTNG galaxies across the plane defined by the average specific star-formation measured over the last 108 (sSFR8) and 109 yr (sSFR9). Quenched galaxies are found below the solid red line, whereas the dotted line delimits the retired domain. Ageing systems are located above both regions. The grey-shaded area denotes the forbidden region of the parameter space. |
| In the text | |
|
Fig. 2. IllustrisTNG sSFRlog(τ) true values versus the median value recovered by BESTA. Coloured maps denote the number of sources in each bin. Bottom to top red lines of every panel correspond to the running 5, 50, and 95 percentiles of sSFRlog(τ) as a function of the true value. Dashed and dotted black lines illustrate the one-to-one and 0.5 dex offset lines, respectively. Each panel includes at the top-right corner the fraction of sources whose true value lies within the 68 and 90% estimated credible intervals, respectively. |
| In the text | |
|
Fig. 3. Statistical distribution of the difference between the input IllustrisTNG values of dust extinction, AV, stellar metallicity, log10(Z*/Z⊙), and total stellar mass, log10(M*/M⊙), versus the median value recovered by BESTA. Each panel includes the fraction of sources whose true value lies within the 68 and 90% estimated credible intervals, respectively. |
| In the text | |
|
Fig. 4. Retired (left), quenched (middle), and ageing (right) galaxy classification purity and completeness, as a function of the minimum probability threshold used to perform the classification. Each redshift sample at z = 0, z = 0.3, and z = 0.6 is denoted by the blue, green, and purple lines, respectively. Coloured arrows denote the value of Pmin(Quenched) that maximises the F-score at each redshift (see Sect. 4.3). |
| In the text | |
|
Fig. 5. Distribution of IllustrisTNG galaxies across the sSFR9 versus sSFR8 plane. Left and right columns show the distribution based on the true (null values of sSFR are arbitrarily set to log10(sSFR/yr−1) = −15) and inferred median values, respectively. Top row panels display the full sample RGB colour-coded by the probability of belonging to the retired, quenched, and ageing classes. Solid and dotted lines represent the demarcation lines given by Eqs. (2) and (3), respectively. Middle and bottom rows illustrate the two proposed approaches for selecting quenched galaxies (coloured points) by colouring in black with low transparency those systems classified as retired or ageing. |
| In the text | |
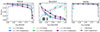 |
Fig. 6. Same as Fig. 4, using the classification presented in Sect. 4.4. |
| In the text | |
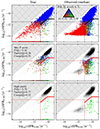 |
Fig. 7. Same as Fig. 5, using the classification presented in Sect. 4.4. |
| In the text | |
|
Fig. 8. Top: Distribution of Euclid galaxies across the stellar mass versus sSFR8 plane. The dotted line denotes the definition of the SFMS by Popesso et al. (2023). Bottom: Distribution of Euclid galaxies across the sSFR9 versus sSFR8 plane. The dotted and solid lines denote the retired and quenched domain demarcation lines, respectively. |
| In the text | |
|
Fig. 9. Fraction of galaxies in different classes as function of total stellar mass. Blue, orange, and red lines denote the fraction of ageing, quenched, and retired galaxies, respectively. Solid and dashed black lines denote the fraction of galaxies with values of sSFR8 and sSFR9 below 10−11 yr−1. The grey-shaded region shows the fraction of galaxies with sSFR ≤ 10−11 yr (estimated using nebular emission lines and optical photometry) from CC21a. Top and bottom panels make use of the posterior- and KDE-based classification (see Sects. 4.2 and 4.4), respectively. Left panels show the fractions computed using a Euclid sample of nearby galaxies (z ≤ 0.1), where the grey-hatched area denotes the mass-completeness limit (see Appendix A). The error bars were estimated from 1000 random samples, each selecting 20% of the total sample and computing the 5 and 95 percentiles. Right panels show the results from the IllustrisTNG sample at z = 0, including the true values (square symbols), where the grey-hatched area denotes the retired mass resolution limit (see Sect. 3.1). |
| In the text | |
|
Fig. 10. Fraction of ageing, quenched, and retired galaxies as function of stellar mass in redshift bins. Each row of panels shows fractions inferred using BESTA for Euclid (top) and IllustrisTNG (middle) samples, along with true fractions from IllustrisTNG (squares). The error bars were estimated from 1000 random samples, each selecting 20% of the total sample and computing the 5 and 95 percentiles. In the top row, fractions for masses below the mass completeness limit (see Appendix A) are shown as dotted lines. Similarly, in IllustrisTNG, masses below the retired resolution limit are represented as dotted lines. |
| In the text | |
|
Fig. 11. Stellar mass size relation for the full sample of Euclid galaxies. From left to right, panels depict the distribution of retired, quenched, ageing, and the three combined classes across the parameter space. Solid and dashed lines denote the 16th, 50th, and 84th running percentiles computed using the Posterior- and KDE-based classifiers, respectively, adopting the criteria that maximises the F-score. The dotted dashed lines denotes the best-fit of Eq. (15) to the percentiles. Top and bottom coloured background maps illustrate the median value per bin of the inferred median stellar metallicity and Sérsic index, respectively, where only bins with more than ten galaxies have been considered. |
| In the text | |
|
Fig. A.1. Stellar mass function in different redshift bins. To account for the different effective areas of the surveys, the distributions are normalised between the mass limits of 3 × 10¹⁰ M⊙, and 1012 M⊙. Dashed lines denote the double-Schechter fit (restricted to z ≤ 0.06) from Baldry et al. (2012). Coloured lines denote the resulting mass function from the different surveys that compose the sample. Black dashed-dotted illustrate the resulting mass function of the total sample. |
| In the text | |
|
Fig. A.2. Completeness of retired galaxies in terms of z, and M*. The coloured map illustrates the 5th percentile of sSFR9 on each z–M* bin. Each bin includes the (uncorrected) fraction of retired galaxies with respect to the total, based on the classification that maximises the F-score. The dashed and solid lines denote the mass completeness limit above which retired galaxies are detected. Each line tracks the lower envelope that satisfies sSFR9 < 10−11 yr−1 and sSFR8 < 3 × 10⁻¹¹ yr−1, based on the 5th and 1st percentiles, respectively. |
| In the text | |
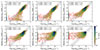 |
Fig. B.1. Same as Fig. 2 but restricted to the estimates at z = 0. |
| In the text | |
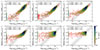 |
Fig. B.2. Same as Fig. 2 but restricted to the estimates at z = 0.3. |
| In the text | |
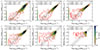 |
Fig. B.3. Same as Fig. 2 but restricted to the estimates at z = 0.6. |
| In the text | |
|
Fig. C.1. Left: Distribution of IllustrisTNG galaxies across the NUVrK colour-colour diagram, coloured according to the classification defined in Sect. 3.1; contours enclosing 68% and 95% of the ageing and retired galaxies are displayed as red and blue lines, respectively, whereas the quenched population is also highlighted by a green shaded area. Black lines indicate the demarcation criteria adopted by Moutard et al. (2018). Vertical and horizontal histograms show the marginal distributions of each class in terms of (NUV − r) and (r − Ks), respectively. Right: Same galaxy sample shown in the sSFR8 versus sSFR9 plane, with colours corresponding to the six-class scheme of Moutard et al. (2018); young (Y) / old (O), quiescent (Q) / green valley (GV) / and star-forming (SF). The yellow shaded area highlights the young quiescent (Y-Q) population. Vertical and horizontal histograms indicate the marginal distributions in sSFR8 and sSFR9, respectively. |
| In the text | |
Current usage metrics show cumulative count of Article Views (full-text article views including HTML views, PDF and ePub downloads, according to the available data) and Abstracts Views on Vision4Press platform.
Data correspond to usage on the plateform after 2015. The current usage metrics is available 48-96 hours after online publication and is updated daily on week days.
Initial download of the metrics may take a while.