


Fig. C.1.
Download original image
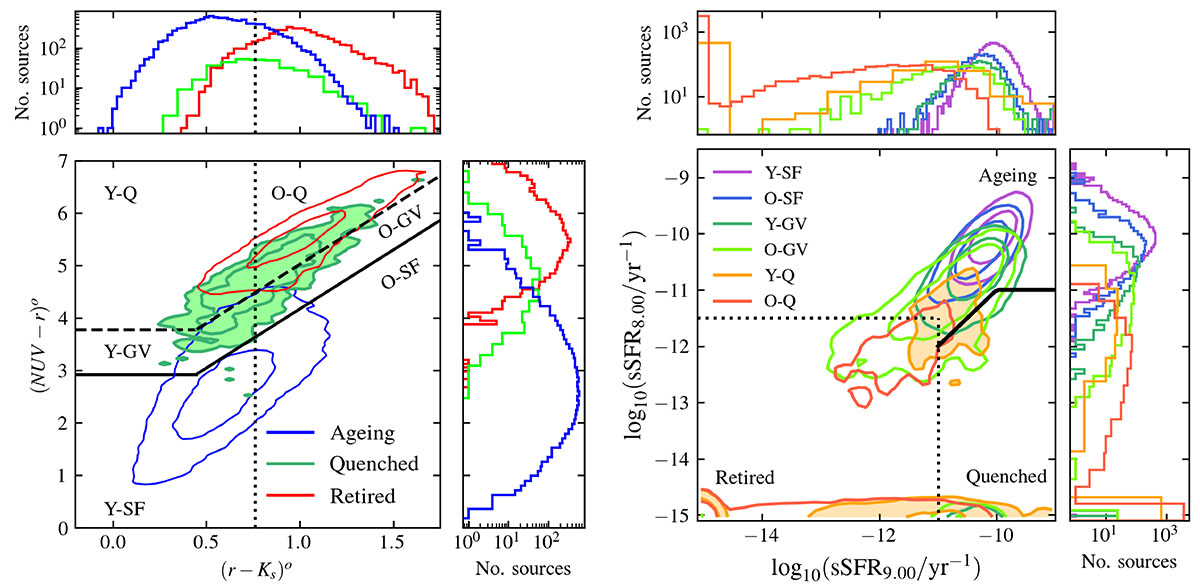
Left: Distribution of IllustrisTNG galaxies across the NUVrK colour-colour diagram, coloured according to the classification defined in Sect. 3.1; contours enclosing 68% and 95% of the ageing and retired galaxies are displayed as red and blue lines, respectively, whereas the quenched population is also highlighted by a green shaded area. Black lines indicate the demarcation criteria adopted by Moutard et al. (2018). Vertical and horizontal histograms show the marginal distributions of each class in terms of (NUV − r) and (r − Ks), respectively. Right: Same galaxy sample shown in the sSFR8 versus sSFR9 plane, with colours corresponding to the six-class scheme of Moutard et al. (2018); young (Y) / old (O), quiescent (Q) / green valley (GV) / and star-forming (SF). The yellow shaded area highlights the young quiescent (Y-Q) population. Vertical and horizontal histograms indicate the marginal distributions in sSFR8 and sSFR9, respectively.
Current usage metrics show cumulative count of Article Views (full-text article views including HTML views, PDF and ePub downloads, according to the available data) and Abstracts Views on Vision4Press platform.
Data correspond to usage on the plateform after 2015. The current usage metrics is available 48-96 hours after online publication and is updated daily on week days.
Initial download of the metrics may take a while.