


Fig. A.1.
Download original image
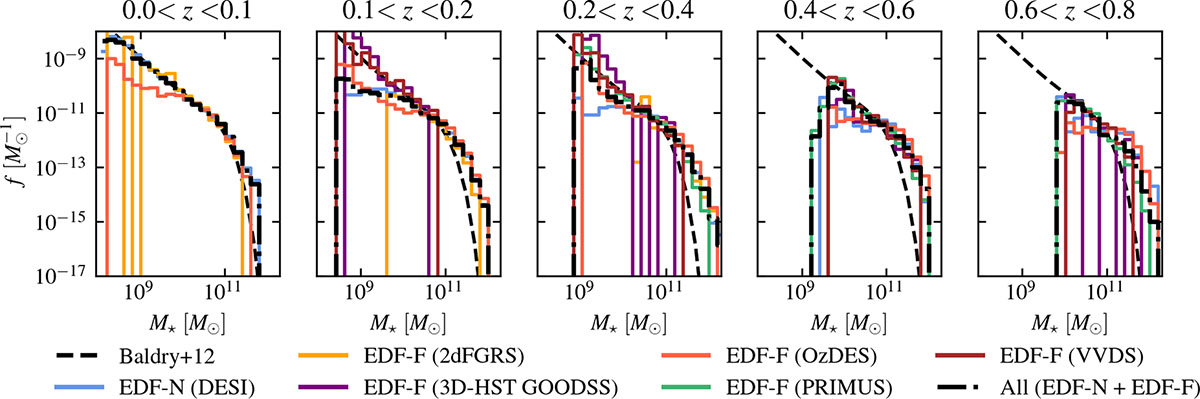
Stellar mass function in different redshift bins. To account for the different effective areas of the surveys, the distributions are normalised between the mass limits of 3 × 10¹⁰ M⊙, and 1012 M⊙. Dashed lines denote the double-Schechter fit (restricted to z ≤ 0.06) from Baldry et al. (2012). Coloured lines denote the resulting mass function from the different surveys that compose the sample. Black dashed-dotted illustrate the resulting mass function of the total sample.
Current usage metrics show cumulative count of Article Views (full-text article views including HTML views, PDF and ePub downloads, according to the available data) and Abstracts Views on Vision4Press platform.
Data correspond to usage on the plateform after 2015. The current usage metrics is available 48-96 hours after online publication and is updated daily on week days.
Initial download of the metrics may take a while.