


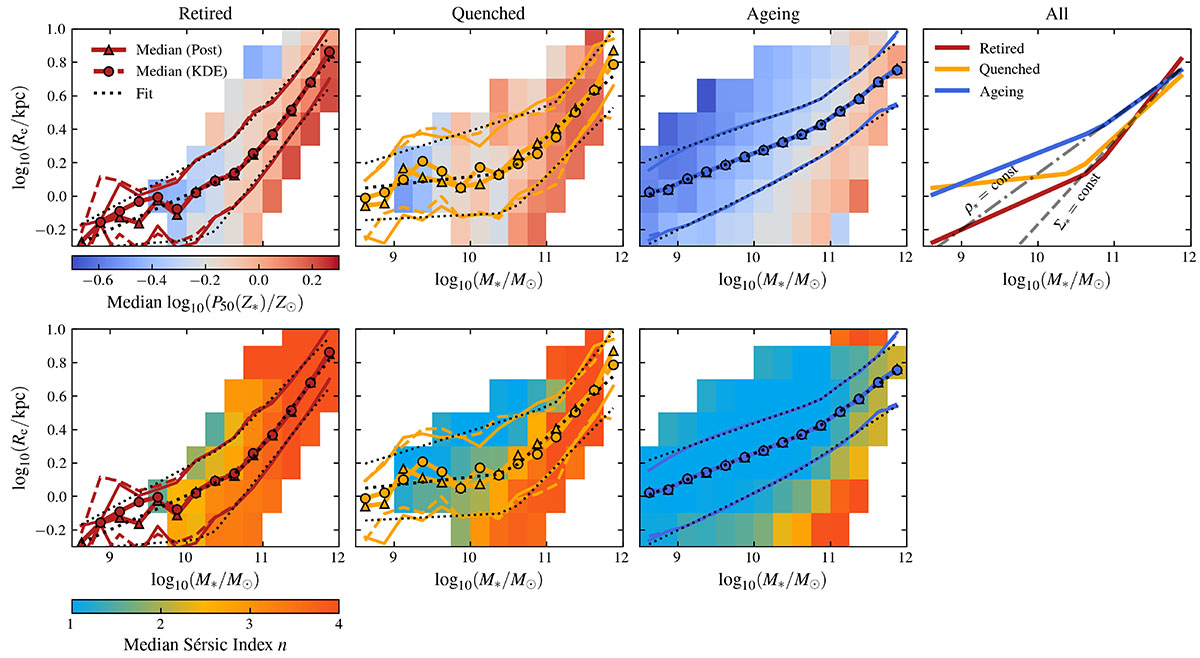
Fig. 11.
Download original image
Stellar mass size relation for the full sample of Euclid galaxies. From left to right, panels depict the distribution of retired, quenched, ageing, and the three combined classes across the parameter space. Solid and dashed lines denote the 16th, 50th, and 84th running percentiles computed using the Posterior- and KDE-based classifiers, respectively, adopting the criteria that maximises the F-score. The dotted dashed lines denotes the best-fit of Eq. (15) to the percentiles. Top and bottom coloured background maps illustrate the median value per bin of the inferred median stellar metallicity and Sérsic index, respectively, where only bins with more than ten galaxies have been considered.
Current usage metrics show cumulative count of Article Views (full-text article views including HTML views, PDF and ePub downloads, according to the available data) and Abstracts Views on Vision4Press platform.
Data correspond to usage on the plateform after 2015. The current usage metrics is available 48-96 hours after online publication and is updated daily on week days.
Initial download of the metrics may take a while.