


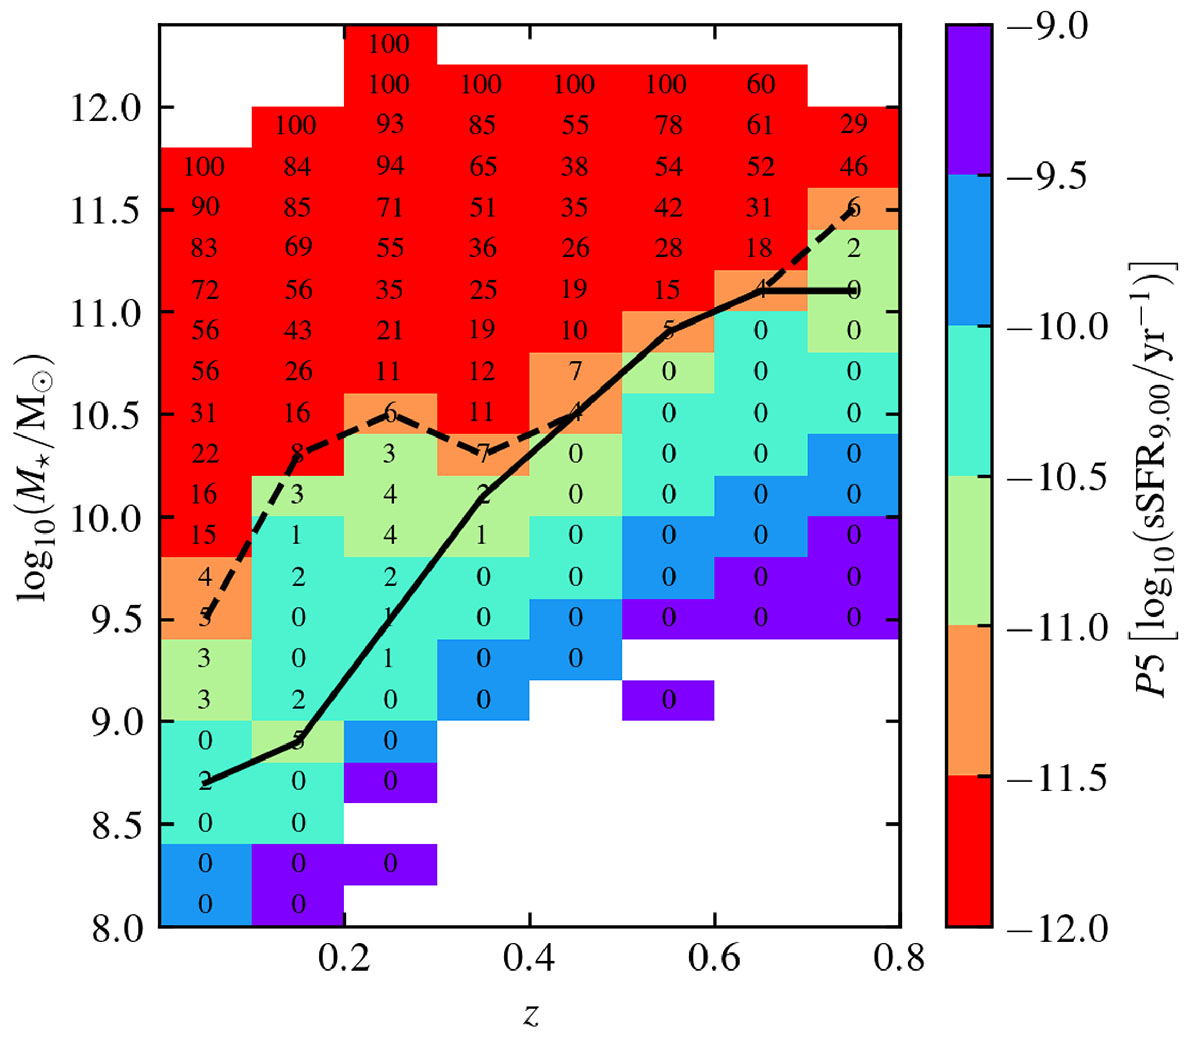
Fig. A.2.
Download original image
Completeness of retired galaxies in terms of z, and M*. The coloured map illustrates the 5th percentile of sSFR9 on each z–M* bin. Each bin includes the (uncorrected) fraction of retired galaxies with respect to the total, based on the classification that maximises the F-score. The dashed and solid lines denote the mass completeness limit above which retired galaxies are detected. Each line tracks the lower envelope that satisfies sSFR9 < 10−11 yr−1 and sSFR8 < 3 × 10⁻¹¹ yr−1, based on the 5th and 1st percentiles, respectively.
Current usage metrics show cumulative count of Article Views (full-text article views including HTML views, PDF and ePub downloads, according to the available data) and Abstracts Views on Vision4Press platform.
Data correspond to usage on the plateform after 2015. The current usage metrics is available 48-96 hours after online publication and is updated daily on week days.
Initial download of the metrics may take a while.