


Fig. 2.
Download original image
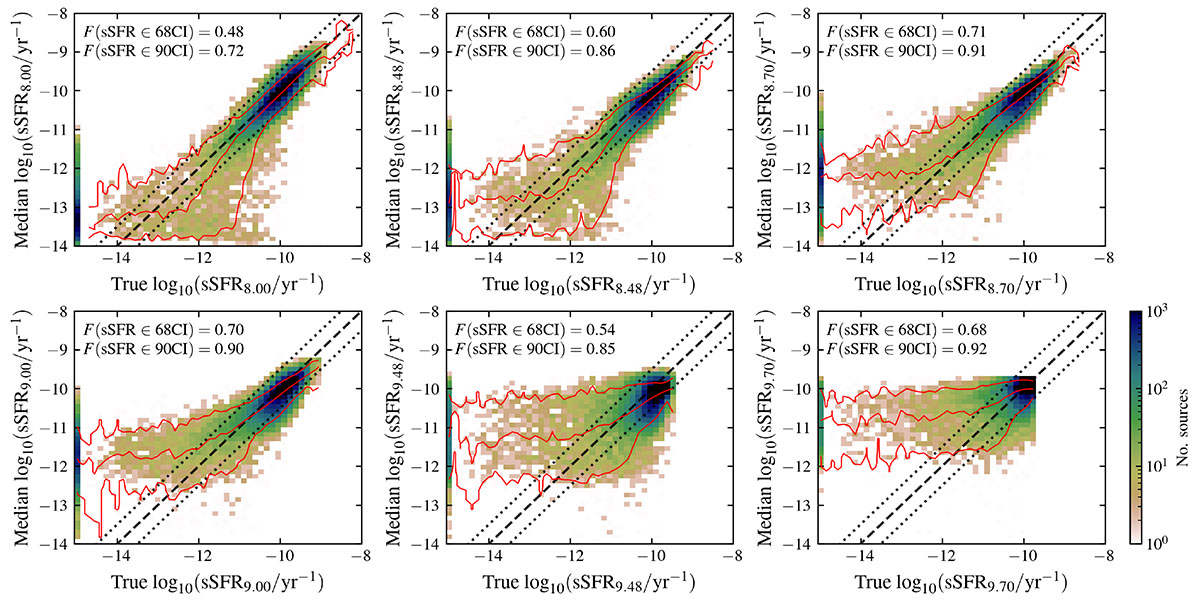
IllustrisTNG sSFRlog(τ) true values versus the median value recovered by BESTA. Coloured maps denote the number of sources in each bin. Bottom to top red lines of every panel correspond to the running 5, 50, and 95 percentiles of sSFRlog(τ) as a function of the true value. Dashed and dotted black lines illustrate the one-to-one and 0.5 dex offset lines, respectively. Each panel includes at the top-right corner the fraction of sources whose true value lies within the 68 and 90% estimated credible intervals, respectively.
Current usage metrics show cumulative count of Article Views (full-text article views including HTML views, PDF and ePub downloads, according to the available data) and Abstracts Views on Vision4Press platform.
Data correspond to usage on the plateform after 2015. The current usage metrics is available 48-96 hours after online publication and is updated daily on week days.
Initial download of the metrics may take a while.