


Fig. 5.
Download original image
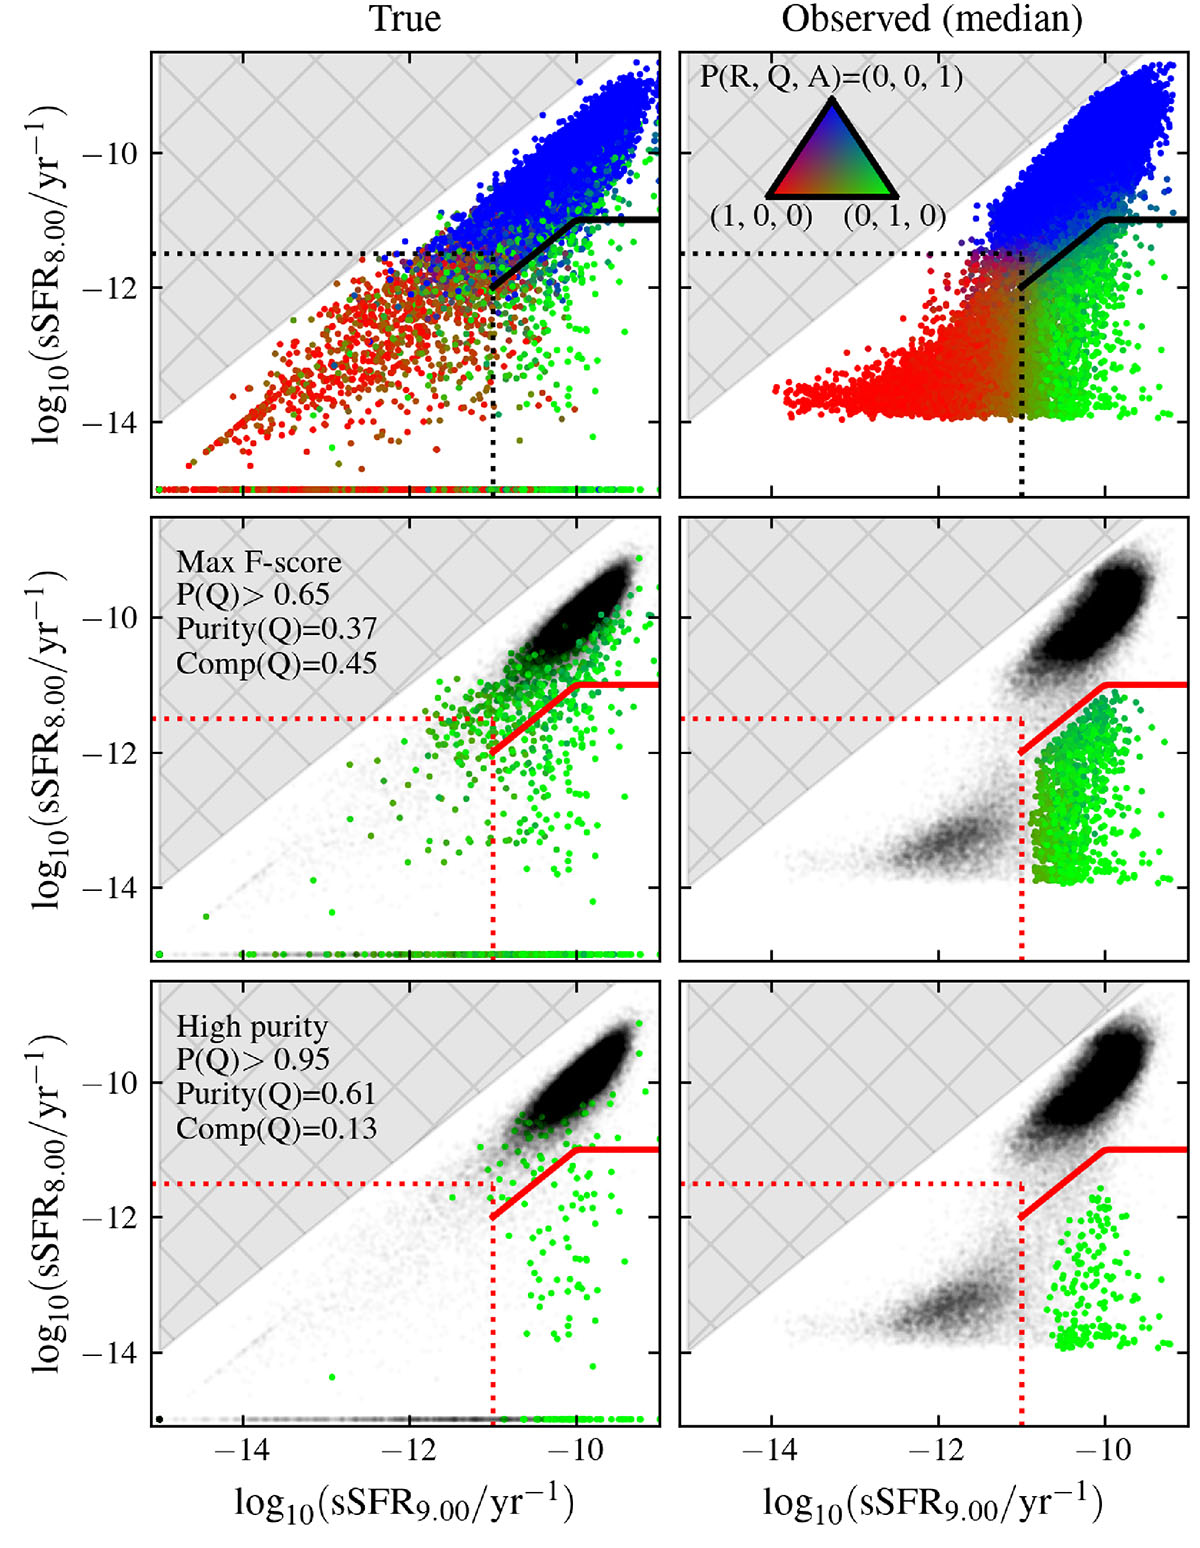
Distribution of IllustrisTNG galaxies across the sSFR9 versus sSFR8 plane. Left and right columns show the distribution based on the true (null values of sSFR are arbitrarily set to log10(sSFR/yr−1) = −15) and inferred median values, respectively. Top row panels display the full sample RGB colour-coded by the probability of belonging to the retired, quenched, and ageing classes. Solid and dotted lines represent the demarcation lines given by Eqs. (2) and (3), respectively. Middle and bottom rows illustrate the two proposed approaches for selecting quenched galaxies (coloured points) by colouring in black with low transparency those systems classified as retired or ageing.
Current usage metrics show cumulative count of Article Views (full-text article views including HTML views, PDF and ePub downloads, according to the available data) and Abstracts Views on Vision4Press platform.
Data correspond to usage on the plateform after 2015. The current usage metrics is available 48-96 hours after online publication and is updated daily on week days.
Initial download of the metrics may take a while.