


Fig. 9.
Download original image
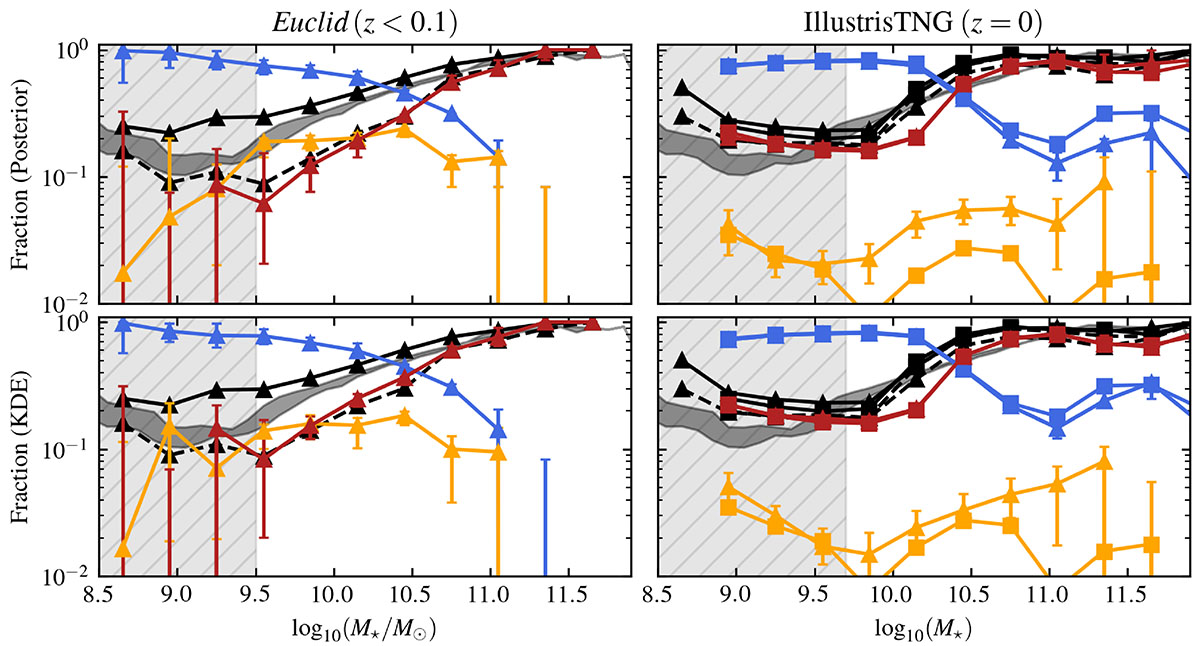
Fraction of galaxies in different classes as function of total stellar mass. Blue, orange, and red lines denote the fraction of ageing, quenched, and retired galaxies, respectively. Solid and dashed black lines denote the fraction of galaxies with values of sSFR8 and sSFR9 below 10−11 yr−1. The grey-shaded region shows the fraction of galaxies with sSFR ≤ 10−11 yr (estimated using nebular emission lines and optical photometry) from CC21a. Top and bottom panels make use of the posterior- and KDE-based classification (see Sects. 4.2 and 4.4), respectively. Left panels show the fractions computed using a Euclid sample of nearby galaxies (z ≤ 0.1), where the grey-hatched area denotes the mass-completeness limit (see Appendix A). The error bars were estimated from 1000 random samples, each selecting 20% of the total sample and computing the 5 and 95 percentiles. Right panels show the results from the IllustrisTNG sample at z = 0, including the true values (square symbols), where the grey-hatched area denotes the retired mass resolution limit (see Sect. 3.1).
Current usage metrics show cumulative count of Article Views (full-text article views including HTML views, PDF and ePub downloads, according to the available data) and Abstracts Views on Vision4Press platform.
Data correspond to usage on the plateform after 2015. The current usage metrics is available 48-96 hours after online publication and is updated daily on week days.
Initial download of the metrics may take a while.