| Issue |
A&A
Volume 557, September 2013
|
|
|---|---|---|
| Article Number | A59 | |
| Number of page(s) | 64 | |
| Section | Extragalactic astronomy | |
| DOI | https://doi.org/10.1051/0004-6361/201221019 | |
| Published online | 30 August 2013 | |
Online material
Appendix A: Kinematic maps
In this Appendix we present the Hα flux, velocity field, and the velocity dispersion maps of the different kinematic components for the galaxies of the sample. When available, the HST image is also included. The spatial offsets between the peaks of the continuum and the Hα flux emission are shown in Table A.1.
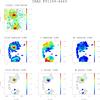 |
Fig. A.1
Top panel: VIMOS continuum (6390−6490) Å image within the rest-frame wavelength range. When available, the HST continuum image is also shown. Middle panel: the Hα flux intensity, velocity field, v (km s-1), and velocity dispersion, σ (km s-1), for the narrow component. Bottom panel: similar maps for the broad component. The flux intensity maps are represented in logarithmic scale (applying a factor of − 13) in units of erg s-1 cm-2 for the Hα flux maps and erg s-1 cm-2 Å-1 for the continuum map. The center (0,0) is identified with the Hα flux intensity peak and the iso-contours of the Hα flux map are overplotted. North is at the top and East to the left in all the panels. IRAS F01159-4443 (ESO 244-G012): this is an interacting pair with a nuclear separation ~8.4 kpc, where the northern galaxy shows the brightest nuclear emission in both the Hα and continuum maps. The two galaxies show regular velocity fields in the narrow component. The scale is 0.462 kpc/′′. |
| Open with DEXTER | |
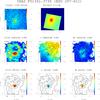 |
Fig. A.2
(General comments about the panels as in Fig. A.1.) IRAS F01341-3735 (ESO 297-G011/G012): this system is composed of two galaxies (i.e., northern, southern) separated by ~25 kpc, implying the need of two VIMOS pointings. The present maps correspond to the northern galaxy, which shows a regular velocity field. The velocity dispersion map has two symmetric local maxima of ~70 km s-1 around the nucleus, which are well fitted using one Gaussian model. These regions have low Hα surface brightness and are associated with high excitation and high σ, as reported by Monreal-Ibero et al. (2010). In the innermost regions (i.e., ~1.5 kpc2), the Hα-[NII] emission lines need a secondary broad component. The spatial scale is of 0.352 kpc/′′. |
| Open with DEXTER | |
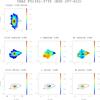 |
Fig. A.3
(General comments about the panels as in Fig. A.1.) ESO 297-G012: this is the southern galaxy of the system IRAS F01341-3735. The Hα emission is oriented perpendicular to the major stellar axis as traced by the continuum image. Although a rotation component is visible in the velocity field along the major photometrical axis, its structure, as well as that of the velocity dispersion map, is irregular. In an inner region (~1 kpc2), the spectra have been fitted with two components, with the broad component blueshifted by ~50 km s-1. The scale is 0.352 kpc/′′. |
| Open with DEXTER | |
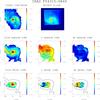 |
Fig. A.4
(General comments about the panels as in Fig. A.1.) IRAS F04315-0840 (NGC 1614): this is a well-studied, post-coalescence late merger, with a bright, spiral structure of a length scale of few kpcs. The velocity field of the narrow component is somewhat distorted and chaotic with an amplitude of 324 km s-1. Its velocity dispersion map shows an offset peak of ~220 km s-1 at around 2.4 kpc from the nucleus in the western arm. The spectra in the inner regions are complex, and a secondary broad component covers a relatively large area of about 8.6 kpc2. The projection of the kinematic major axes of the narrow (main) and broad components differs by ~90°. The blueshifted region of the velocity field of the broad component has the largest velocity dispersion (i.e., ~400 km s-1). All this supports the hypothesis of a dusty outflow, where the receding components (which are behind the disk) are obscured, making the whole profile relatively narrow with respect to the approaching component. This object has been analyzed in Bellocchi et al. (2012). The spatial scale is 0.325 kpc/′′. |
| Open with DEXTER | |
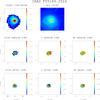 |
Fig. A.5
(General comments about the panels as in Fig. A.1.) IRAS F05189-2524: this galaxy shows a compact Hα emission, both in the narrow and broad components.Their velocity fields and velocity dispersion maps do not show regular patterns. The broad component is blueshifted up to ~400 km s-1 with respect to the narrow one and is dominant in terms of flux in the innermost spaxels. The scale is of 0.839 kpc/′′. |
| Open with DEXTER | |
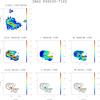 |
Fig. A.6
(General comments about the panels as in Fig. A.1.) IRAS F06035-7102: this system consists of two pre-coalescence galaxies with a nuclear separation of ~8 kpc. The velocity dispersion map of the narrow component clearly shows an irregular pattern, in which the two local maxima correspond to low Hα surface brightness regions. The spatial scale is 1.5 kpc/′′. |
| Open with DEXTER | |
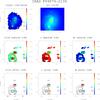 |
Fig. A.7
(General comments about the panels as in Fig. A.1.) IRAS F06076-2139: this system consists of two galaxies in interaction with a rather complex morphology. The Hα image shows a rather different structure than that shown by the VIMOS continuum and the HST-ACS image. The southern galaxy is characterized by a ring and a tidal tail-like structures extending towards the west and northwest part from the nucleus. The faint broad component found in a small region of the ring in the southern object is likely due to the superposition of the emission of the two galaxies along the line-of-sight. This system was already studied in Arribas et al. (2008). The scale is 0.743 kpc/′′. |
| Open with DEXTER | |
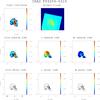 |
Fig. A.8
(General comments about the panels as in Fig. A.1.) IRAS F06206-6315: this system has a double nuclei separated by ~4 kpc, as clearly seen in the the Near Infrared Camera and Multi-Object Spectrometer (NICMOS/HST) image. There is a tidal tail starting in the north and bending towards the southeast, which contains a local peak of Hα emission (i.e., a possible tidal dwarf galaxy candidate). The brightest nucleus seems to be in positional agreement with the kinematic center. The velocity field is regular, and most of the spectra are well fitted using one component. The scale is of 1.72 kpc/′′. |
| Open with DEXTER | |
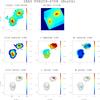 |
Fig. A.9
(General comments about the panels as in Fig. A.1.) IRAS F06259-4708 (ESO 255-IG007): two VIMOS pointings were used during the observation of this triple system. The two brightest galaxies, the northern and the central ones, are separated by a distance of ~11 kpc, while the third one is located at ~13 kpc to the south from the central galaxy (see next panel). The present panels correspond to the northern and central galaxies, which show a regular velocity field pattern. The scale is of 0.769 kpc/′′. |
| Open with DEXTER | |
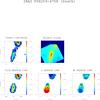 |
Fig. A.10
(General comments about the panels as in Fig. A.1.) ESO 255-IG007: this is the southern galaxy of the system IRAS F06259-4708. It has a regular velocity field and the velocity dispersion map. One single Gaussian component is adequate to fit the Hα-[NII] emission lines of this galaxy. The scale is 0.769 kpc/′′. |
| Open with DEXTER | |
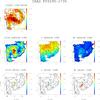 |
Fig. A.11
(General comments about the panels as in Fig. A.1.) IRAS F06295-1735 (ESO 557-G002): the continuum image of this barred spiral shows vertical strips, which were not possible to remove during the reduction process (see Rodríguez-Zaurín et al. 2011). However, the Hα maps are not affected by this problem. Interestingly, neither the arms nor the bar in the Hα image coincide with those in the continuum image. The velocity field shows a regular structure, while its velocity dispersion map reaches the highest values (i.e., σ ~ 70–80 km s-1) at about 2 kpc to the south of the nucleus, in a region of relatively low emission. The scale is of 0.431 kpc/′′. |
| Open with DEXTER | |
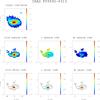 |
Fig. A.12
(General comments about the panels as in Fig. A.1.) IRAS 06592-6313: this spiral galaxy shows a minor kinematic axis not aligned with the corresponding photometric one. Its velocity field shows a regular pattern with an amplitude of 160 km s-1, while the velocity dispersion map shows some structure around the nucleus. A broad component blueshifted up to ~300 km s-1 has been found in the inner regions. The scale is of 0.464 kpc/′′. |
| Open with DEXTER | |
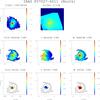 |
Fig. A.13
(General comments about the panels as in Fig. A.1.) IRAS F07027-6011 (AM 0702-601): this system consists of two galaxies separated by ~54 kpc. The present maps correspond to the northern galaxy. This object has a regular velocity field, while the velocity dispersion map shows a local maximum offset by ~0.4 kpc with respect to the nucleus (or Hα flux peak). The secondary component found in the inner part shows a σmean of about 320 km s-1, which can be explained by the fact that this galaxy possibly hosts an AGN (see Arribas et al. 2012). The spatial scale is of 0.626 kpc/′′. |
| Open with DEXTER | |
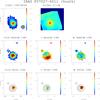 |
Fig. A.14
(General comments about the panels as in Fig. A.1.) IRAS F07027-6011 (AM 0702-601): these maps correspond to the southern galaxy of the system. The velocity field of the narrow component is rather regular. In the velocity dispersion map a local maximum is found in correspondence of the nucleus (or Hα peak). The spatial scale is of 0.626 kpc/′′. |
| Open with DEXTER | |
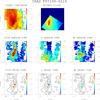 |
Fig. A.15
(General comments about the panels as in Fig. A.1.) IRAS F07160-6215 (NGC 2369): this is an edge-on dusty galaxy, whose structure could strongly affect the pattern of its velocity field and velocity dispersion map. Indeed, the velocity field has a clear rotation component with some irregularities, and the velocity dispersion map shows distorted inner (~1 kpc) regions, with values ranging between 120 and 200 km s-1, where a broad component has been considered to properly fit the spectra. The scale is 0.221 kpc/′′. |
| Open with DEXTER | |
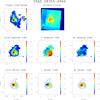 |
Fig. A.16
(General comments about the panels as in Fig. A.1.) IRAS 08355-4944: this galaxy is morphologically classified as a post-coalescence merger. It has a quite regular velocity pattern and a relatively disturbed structure in the velocity dispersion map. Most of the spectra in the inner region have been fitted applying 2-Gaussian fit. The spatial scale is 0.521 kpc/′′. |
| Open with DEXTER | |
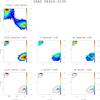 |
Fig. A.17
(General comments about the panels as in Fig. A.1.) IRAS 08424-3130 (ESO 432-IG006): the Digital Sky Survey (DSS) image shows a pair of spiral galaxies (nuclear separation of ~9 kpc) in interaction. Only part of the nuclear region of both galaxies is covered by our VIMOS FoV. The area covered by the Hα emission line for the northern galaxy is very small, so that its kinematical classification was not possible. The southern object reveals a relatively regular velocity field with an amplitude of 133 km s-1 and an almost centrally peaked velocity dispersion map. The spatial scale is 0.329 kpc/′′. |
| Open with DEXTER | |
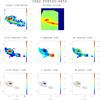 |
Fig. A.18
(General comments about the panels as in Fig. A.1.) IRAS F08520-6850 (ESO 60-IG016): this system is composed of two disk galaxies in interaction with a nuclear separation of 10 kpc. The Hα flux peak and the kinematic center of the eastern source are in positional agreement. The velocity fields of the respective galaxies are regular. The spatial scale is 0.909 kpc/′′. |
| Open with DEXTER | |
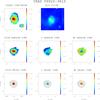 |
Fig. A.19
(General comments about the panels as in Fig. A.1.) IRAS F09022-3615: the velocity field is quite distorted and irregular with poorly defined kinematic axes. The ring of high-velocity dispersion around the nucleus has several local peaks. A broad component is present in the inner parts. The spatial scale is of 1.153 kpc/′′. |
| Open with DEXTER | |
 |
Fig. A.20
(General comments about the panels as in Fig. A.1.) IRAS F09437+0317 (IC 564/IC 563): this system is formed by two galaxies (north: IC 564/ south: IC 563) with a nuclear separation of about 39 kpc. Three VIMOS pointings were carried out for observing this system. For the northern galaxy (IC 564), two pointings sample the northeast (NE) and the southwest (SW) parts of the galaxy (see Fig.1 Paper III); both of them have been used to derived the mean kinematic values (Table 4). These panels (i.e., ~50′′ × 40′′) were generated by combining the NE and NW pointings. A faint broad component was found in correspondence of an offset Hα peak in the SW direction, possibly due to the presence of a star-forming region. The velocity field is regular, and the kinematic center seems to be in positional agreement with the continuum and Hα flux peaks. The spatial scale is 0.415 kpc/′′. |
| Open with DEXTER | |
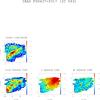 |
Fig. A.21
(General comments about the panels as in Fig. A.1.) IRAS F09437+0317 (IC 563): this object shows a very regular velocity field and a centrally peaked velocity dispersion map. The VIMOS continuum image is considered the center of the image since the Hα peak is offset due to a knot of star formation and does not properly define the center. The spatial scale is 0.415 kpc/′′. |
| Open with DEXTER | |
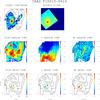 |
Fig. A.22
(General comments about the panels as in Fig. A.1.) IRAS F10015-0614 (NGC 3110): this galaxy shows two well-defined spiral arms in NICMOS/HST image. The velocity field and the velocity dispersion maps reproduce the spiral structure of this galaxy. Broad-profile spectra are found in regions of low-Hα surface brightness round the nucleus.The spatial scale is 0.343 kpc/′′. |
| Open with DEXTER | |
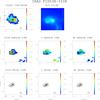 |
Fig. A.23
(General comments about the panels as in Fig. A.1.) IRAS F10038-3338 (IC 2545): the VIMOS continuum image shows two nuclei separated by ~3 kpc. The Hα peak corresponds to the eastern nucleus. The velocity field and velocity dispersion maps are quite disturbed. The broad component is blueshifted by 100 km s-1. The scale is of 0.679 kpc/′′. |
| Open with DEXTER | |
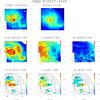 |
Fig. A.24
(General comments about the panels as in Fig. A.1.) IRAS F10257-4338 (NGC 3256): this galaxy has a somewhat complex morphological structure. It shows a clumpy pattern in the Hα flux intensity map. The velocity field of the narrow component has the kinematic axes not well defined, though a rotation component with an amplitude of 170 km s-1 can be identified. The velocity dispersion map shows high values in regions where high ionized gas is found (see Monreal-Ibero et al. 2010). The broad component has been found in a quite large and irregular area. The scale is of 0.192 kpc/′′. |
| Open with DEXTER | |
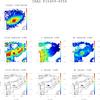 |
Fig. A.25
(General comments about the panels as in Fig. A.1.) IRAS F10409-4556 (ESO 264-G036): this is an isolated barred spiral galaxy morphologically classified as type 0 (i.e., isolated disk). Its velocity field is very regular and the velocity dispersion map is centrally peaked. The spatial scale is 0.425 kpc/′′. |
| Open with DEXTER | |
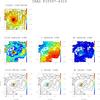 |
Fig. A.26
(General comments about the panels as in Fig. A.1.) IRAS F10567-4310 (ESO 264-G057): the continuum image shows vertical patterns, which were not possible to remove during the reduction process (see Rodríguez-Zaurín et al. 2011). However, the Hα maps are not affected by this problem. The narrow component shows a very regular velocity field and a centrally peaked velocity dispersion map. This object has been analyzed in Bellocchi et al. (2012). The scale is 0.35 kpc/′′. |
| Open with DEXTER | |
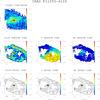 |
Fig. A.27
(General comments about the panels as in Fig. A.1.) IRAS F11255-4120 (ESO 319-G022): this is a barred spiral with a circumnuclear ring structure that is at ~4 kpc from the nuclear region in the Hα image but not observed in the continuum images. Interestingly, the orientation of the bar seen in continuum emission (PA ~ 110°) is different from that of the ionized gas emission (PA ~ 150°). The projected orientation of the rotation axis (minor kinematic axis) seems to be different by about 30° from that of the minor photometric axis (and the bar in the Hα flux intensity map) but is well aligned with the bar in the continuum. The kinematic center closely agrees with that of the Hα flux and the continuum peaks. The velocity field is very regular and the velocity dispersion map has an almost centrally peaked structure with a local maximum of 120 km s-1 in the bar structure. This object has been previously studied in Bellocchi et al. (2012). The scale is of 0.333 kpc/′′. |
| Open with DEXTER | |
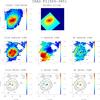 |
Fig. A.28
(General comments about the panels as in Fig. A.1.) IRAS F11506-3851 (ESO 320-G030): a circumnuclear ring structure is detected in the Hα image. The velocity field is extremely regular and the velocity dispersion map is centrally peaked (i.e., σc = 81 km s-1) with high values (i.e., ~60 km s-1) outwards the ring structure. The spatial scale is of 0.221 kpc/′′. |
| Open with DEXTER | |
 |
Fig. A.29
(General comments about the panels as in Fig. A.1.) IRAS 12043-3140 (ESO 440-IG058): this system consists of two galaxies with a nuclear separation of ~6 kpc. The northern galaxy is compact, while the southern source presents several knots in the Hα map. The velocity field of the southern galaxy has two relatively well-defined approaching and receding parts, with the kinematic and photometric axes in relatively good agreement. Its velocity dispersion map reaches the highest values (i.e., σ ~ 250 km s-1) in the northern part, in correspondence of a local maximum of the Hα intensity map. Around that region, a secondary broad component has been found in some spectra . The stellar distribution (i.e., continuum map) of the northern galaxy suggests that it is almost face-on: this could possibly explain the derived relatively low velocity shear (i.e., ~42 km s-1). Its velocity field shows a somewhat irregular pattern. The scale is of 0.468 kpc/′′. |
| Open with DEXTER | |
 |
Fig. A.30
(General comments about the panels as in Fig. A.1.) IRAS 12115-4656 (ESO 267-G030): the Hα image shows a peak displaced by 0.8 kpc in the southwest direction with respect to the nucleus (continuum maximum). The kinematic center is in positional agreement with the nucleus. The velocity field and velocity dispersion map are those typical of a rotating disk-like object. At about ~3 kpc northwest from the nucleus, the spectra show the presence of two kinematically distinct components. The scale is of 0.375 kpc/′′. |
| Open with DEXTER | |
 |
Fig. A.31
(General comments about the panels as in Fig. A.1.) IRAS 12116-5615: this is one of the few objects for which the morphological classification is uncertain (class 2 or 0). It shows a very compact Hα emission. The Hα velocity field has a typical rotation pattern, but the velocity dispersion map is not centrally peaked. The latter shows higher values in the outer parts, which also have high excitation and low-Hα surface brightness (see Monreal-Ibero et al. 2010). The scale is of 0.545 kpc/′′. |
| Open with DEXTER | |
 |
Fig. A.32
(General comments about the panels as in Fig. A.1.) IRAS 12596-1529 (MGC-02-33-098): this system is interacting with MCG-02-33-099, at ~37 kpc in the southeast direction. The HST image clearly shows two distinct galaxies in interaction, still visible in the VIMOS Hα flux intensity map, where the nuclei are separated by ~5 kpc. For this system it was not possible to reliably separate the contribution of each object. The two galaxies have been considered as a whole systems, deriving the mean kinematic values reported in Table 4. However, the velocity field shows a quite regular pattern. The velocity dispersion map does not have a well-defined structure with a maximum of ~200 km s-1 in the northern part of the western galaxy: in this region low-Hα surface brightness spectra are well fitted using one component and for this reason show a broader profile. However, no kinematic classification can be inferred from the whole system. The spatial scale is of 0.324 kpc/′′. |
| Open with DEXTER | |
 |
Fig. A.33
(General comments about the panels as in Fig. A.1.) IRAS F13001-2339 (ESO 507-G070): the velocity field and velocity dispersion map have an irregular pattern. Some of the spectra in the northern region show a broad profile and relatively high excitation (see Monreal-Ibero et al. 2010). Its scale is of 0.439 kpc/′′. |
| Open with DEXTER | |
 |
Fig. A.34
(General comments about the panels as in Fig. A.1.) IRAS F13229-2934 (NGC 5135): the morphology of the ionized gas emission is substantially different from that of the continuum. Moreover, the photometric major axis of the continuum image seems to be perpendicular with respect to that of the Hα flux intensity in the inner regions. The spatial scale is 0.28 kpc/′′. |
| Open with DEXTER | |
 |
Fig. A.35
(General comments about the panels as in Fig. A.1.) IRAS F14544-4255 (IC 4518): this system is formed by two galaxies with a nuclear separation ~12 kpc, which were observed separately using two VIMOS pointings. The present panels correspond to the eastern source. This galaxy has a faint tail extended towards the northwest, as seen in the DSS image (see Paper III). The Hα image reveals a very strong knot of star formation towards the southeast of the nucleus (~2.5 kpc): for this reason, the VIMOS continuum peak is used to identify the center (0,0) of the images. The velocity field is rather regular, although some deviations of pure rotation pattern are seen towards the west, probably due to the projection of star-forming knots with peculiar velocity. Its velocity dispersion map has a relatively constant value of σmean ~ 60 km s-1 in almost the whole FoV. The broad component found in a few spectra has velocity dispersion values similar to those of the narrow component. The spatial scale is of 0.32 kpc/′′. |
| Open with DEXTER | |
 |
Fig. A.36
(General comments about the panels as in Fig. A.1.) IRAS F14544-4255 (IC 4518): this is the western source of the system. It is more compact than the eastern one, although some extended emission is also observed towards the northwest likely associated with two star-forming knots. The velocity field has some irregularities (i.e., two maxima in the redshifted part), although a weak rotation pattern is visible. The velocity dispersion map shows a maximum of 300 km s-1 on the eastern part of this galaxy at 0.9 kpc from the Hα flux peak. The high values of the velocity dispersion of the narrow component correspond to low-Hα surface brightness spectra. The spectra showing a secondary broad component in this object are quite complex. The spatial scale is 0.32 kpc/′′. |
| Open with DEXTER | |
 |
Fig. A.37
(General comments about the panels as in Fig. A.1.) IRAS F17138-1017: the velocity field is regular, while the velocity dispersion map has no defined pattern. The continuum image shows vertical patterns that could not be removed during the reduction process (see Rodríguez-Zaurín et al. 2011). However, the Hα maps (flux intensity and velocity field) are not affected by this problem. The spatial scale is 0.352 kpc/′′. |
| Open with DEXTER | |
 |
Fig. A.38
(General comments about the panels as in Fig. A.1.) IRAS F18093-5744: the whole system consists of three galaxies in interaction, which have been observed separately. The nuclear separations between the northern (IC 4687) and the central galaxy (IC 4686) and between the central and the southern galaxy (IC 4689) are ~10 kpc and ~20 kpc, respectively. The HST (F110W) image shows a spiral-like morphology for IC 4687, with several knots and concentrations in the nuclear region. IC 4687 shows a velocity field dominated by rotation, with the kinematic center well defined and coincident with the nucleus (continuum maximum). On the other hand, the velocity dispersion map shows an almost centrally peaked map, with higher values in the outer parts of the galaxy, corresponding to ionized regions (see Monreal-Ibero et al. 2010). The scale is 0.353 kpc/′′. |
| Open with DEXTER | |
 |
Fig. A.39
(General comments about the panels as in Fig. A.1.) IRAS F18093-5744 (C): the Hα emission from the source is highly concentrated in the nuclear region. Ionized gas emission is also observed extending towards the northwest of the nuclear region, probably as part of a tidal tail linking this galaxy with IC 4687. The VIMOS continuum emission is strongly contaminated by a star located in the northwest part with respect to the galaxy. The northern/western part of the velocity field is dominated by the kinematics of the tidal tail, which shows redshifted velocities and very low velocity dispersion: the blue part of the velocity field is not well defined, even excluding the region south of the nucleus. Due to the presence of the tidal tail, the interpretation of the broad component in the innermost region is uncertain (i.e., it may correspond to the main systemic component because it is the narrow one associated with the tidal tail). The scale is 0.353 kpc/′′. |
| Open with DEXTER | |
 |
Fig. A.40
(General comments about the panels as in Fig. A.1.) IRAS F18093-5744 (S) (IC 4689): this galaxy has a spiral morphology in the NICMOS/HST image, without clear evidence of strong interaction with the other galaxies of the system. The kinematic center seems to be coincident with the VIMOS continuum peak: the velocity field shows a mostly regular pattern, typical of a rotation-dominated disk-like object. Its velocity dispersion map shows a centrally peaked structure. It also shows regions in the northern part with relatively large velocity dispersion (~100 km s-1). A small area (~0.6 kpc2) at the center shows the presence of a broad component, blueshifted by ~85 km s-1. The scale is 0.353 kpc/′′. |
| Open with DEXTER | |
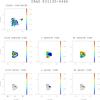 |
Fig. A.41
(General comments about the panels as in Fig. A.1.) IRAS F21130-4446: this system has a double nucleus with a separation of 5.4 kpc (i.e., Dasyra et al. 2006b). The peak of the continuum emission coincides with the location of the northern (weaker) Hα condensation. The velocity field has a quite complex structure. The velocity dispersion map shows a distorted and irregular structure. The scale is of 1.72 kpc/′′. |
| Open with DEXTER | |
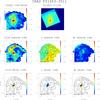 |
Fig. A.42
(General comments about the panels as in Fig. A.1.) IRAS F21453-3511 (NGC 7130): the velocity field and velocity dispersion maps of the narrow component show asymmetric patterns. In the velocity field three main regions can be identified with the rotation axes not well-defined. The velocity dispersion map shows high values in the northern arm and its central part, with values larger than 100 km s-1. This object has been analyzed in Bellocchi et al. (2012). The scale is 0.329 kpc/′′. |
| Open with DEXTER | |
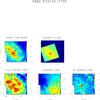 |
Fig. A.43
(General comments about the panels as in Fig. A.1.) IRAS F22132-3705 (IC 5179): the velocity field of this source has the typical “spider-diagram” shape characterizing a rotating disk-like object. The kinematic center and the peak of the velocity dispersion map are well defined and coincident with the VIMOS continuum maximum and the Hα flux peak. In the south and northwest there are regions with velocity dispersion of the order of 50 km s-1. The spatial scale is 0.234 kpc/′′. |
| Open with DEXTER | |
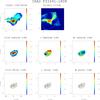 |
Fig. A.44
(General comments about the panels as in Fig. A.1.) IRAS F22491-1808: this is a double nucleus system (separation of 2.6 kpc) with several knots and condensations located in both the nuclear region and the tidal tails observed to the east and northwest of the system. The Hα image shows a more compact morphology than that of the continuum, with no evidence for the already mentioned tidal tails. This system seems to be kinematically disturbed, with a poorly defined minor rotation axis, although a rotation pattern is visible. The velocity dispersion map has a quite irregular structure, with an offset peak with respect to the nucleus and high values in correspondence of low Hα surface brightness. There are two regions where the spectra profiles suggest the presence of an extra broad component. The scale is of 1.47 kpc/′′. |
| Open with DEXTER | |
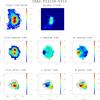 |
Fig. A.45
(General comments about the panels as in Fig. A.1.) IRAS F23128-5919 (AM 2312-591): this is a ULIRG with a double nucleus (separation of ~4 kpc). It has not been possible to separate reliably the contribution of each individual galaxy and, therefore, the kinematic values reported in Table 4 correspond to the whole system. The velocity field has a quite complex pattern, where the two galaxies merger their velocity fields. A relatively extended broad component has been found in the inner regions of this system, covering an area of 55 kpc2 and with a mean blueshift of 32 km s-1. The velocity maps of this second component suggest the presence of a strong outflow. The scale is of 0.878 kpc/′′. |
| Open with DEXTER | |
Spatial offsets between the VIMOS continuum and Hα flux peaks.
Appendix B: Effective radius determinations based on near-infrared continuum imaging
Rest frame near-IR continuum light traces to first order the bulk of the galaxy stellar component. Here we obtain near-IR-based effective radii Reff for the present sample from infrared imaging obtained from the literature. Specifically, we have compiled the Ks-band images from the 2MASS (Skrutskie et al. 2006), and the existing near-IR imaging obtained with HST in H-band (K-band HST imaging is restricted to a reduced number of objects). The 2MASS images have the advantage of being available for all the galaxies in the sample and without limitations by FoV. On the other hand, they have a relatively low angular resolution (i.e., ~2′′), which prevents us from distinguishing kpc-scale structures for many objects in the sample. The HST imaging obviously solves this problem, but in contrast the relatively small FoV of the Near Infrared Camera and Multi-Object Spectrometer (NICMOS) imposes serious limitations for the closest systems. NICMOS/HST H-band infrared imaging existed for about 50 percent of the sample. A few cases were observed with WFC3, which combines good angular resolution and a relatively large FoV.
Two methods have been used to derive the effective radii using 2MASS and HST images: 1)
GALFIT (Peng et al. 2010) and 2) the so-called
A/2 method, for which the effective radius is defined as
 and where A is the solid angle subtended by the minimum number of pixels encompassing 50
percent
of the galaxy light for the images considered. GALFIT and A/2 methods agree relatively well: in general, radii smaller than ~20% are derived when applying the A/2 method. For those cases with clearly defined disks, the GALFIT radii were preferred to those with the A/2 method. For systems with a high ellipticity or with linear structure, GALFIT tends to interpret them as inclined or edge-on disks. This interpretation is correct in some cases, but in others the actual morphology of the system is distorted by tidal forces or it is uncertain. Also, for highly structured images (generally from HST) the A/2 measurements tend to be smaller than those from GALFIT.
The HST-based measurements tend to be smaller (~10%) than the 2MASS ones as a consequence of the relatively small FoV, which often does not cover the whole galaxy emission. Furthermore, the wavelength dependence of the radius measurements between the H- and K-bands are expected to be very small. In fact, Veilleux et al. (2002) found that the mean values obtained from K-band imaging were about 38 percent smaller than those obtained in the optical (R-band). Assuming conservatively that this difference is mainly due to reddening, one should expect a minor change between the values inferred at H and K.
In Table B.1 we present the individual results of the derived effective radii when applying the two methods to the 2MASS and HST images, as well as the adopted values and their estimated uncertainties. The table includes a code that indicates the values considered for deriving the adopted one.
Near-IR continuum (stellar) radii determinations.
© ESO, 2013
Current usage metrics show cumulative count of Article Views (full-text article views including HTML views, PDF and ePub downloads, according to the available data) and Abstracts Views on Vision4Press platform.
Data correspond to usage on the plateform after 2015. The current usage metrics is available 48-96 hours after online publication and is updated daily on week days.
Initial download of the metrics may take a while.


