Fig. A.1
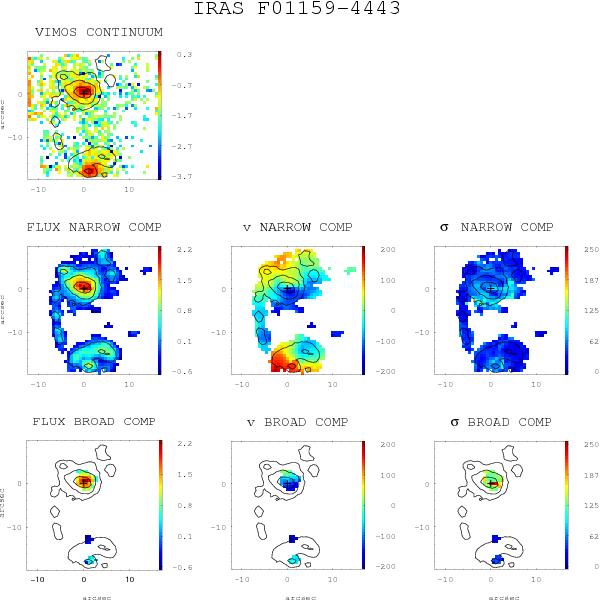
Top panel: VIMOS continuum (6390−6490) Å image within the rest-frame wavelength range. When available, the HST continuum image is also shown. Middle panel: the Hα flux intensity, velocity field, v (km s-1), and velocity dispersion, σ (km s-1), for the narrow component. Bottom panel: similar maps for the broad component. The flux intensity maps are represented in logarithmic scale (applying a factor of − 13) in units of erg s-1 cm-2 for the Hα flux maps and erg s-1 cm-2 Å-1 for the continuum map. The center (0,0) is identified with the Hα flux intensity peak and the iso-contours of the Hα flux map are overplotted. North is at the top and East to the left in all the panels. IRAS F01159-4443 (ESO 244-G012): this is an interacting pair with a nuclear separation ~8.4 kpc, where the northern galaxy shows the brightest nuclear emission in both the Hα and continuum maps. The two galaxies show regular velocity fields in the narrow component. The scale is 0.462 kpc/′′.
Current usage metrics show cumulative count of Article Views (full-text article views including HTML views, PDF and ePub downloads, according to the available data) and Abstracts Views on Vision4Press platform.
Data correspond to usage on the plateform after 2015. The current usage metrics is available 48-96 hours after online publication and is updated daily on week days.
Initial download of the metrics may take a while.