Fig. A.33
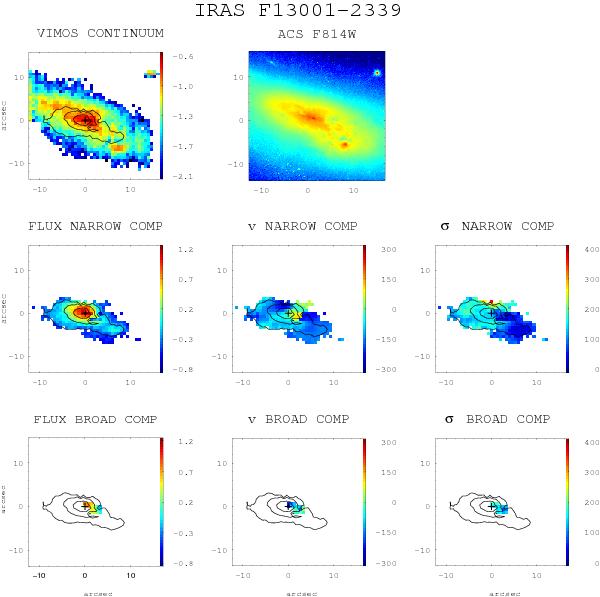
(General comments about the panels as in Fig. A.1.) IRAS F13001-2339 (ESO 507-G070): the velocity field and velocity dispersion map have an irregular pattern. Some of the spectra in the northern region show a broad profile and relatively high excitation (see Monreal-Ibero et al. 2010). Its scale is of 0.439 kpc/′′.
Current usage metrics show cumulative count of Article Views (full-text article views including HTML views, PDF and ePub downloads, according to the available data) and Abstracts Views on Vision4Press platform.
Data correspond to usage on the plateform after 2015. The current usage metrics is available 48-96 hours after online publication and is updated daily on week days.
Initial download of the metrics may take a while.