Fig. A.11
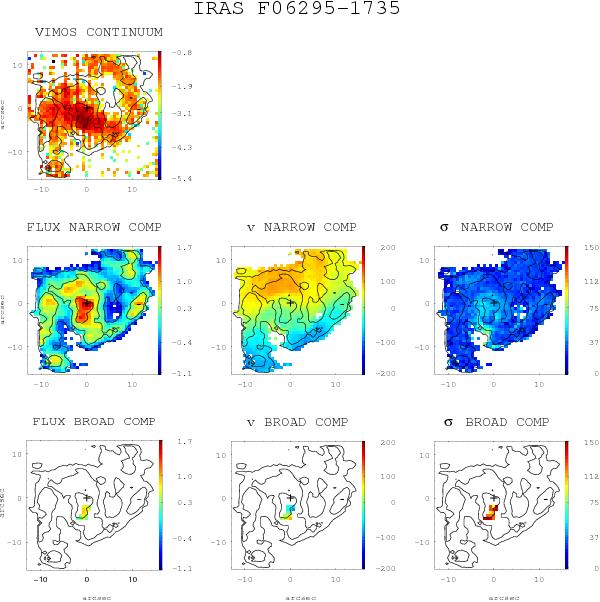
(General comments about the panels as in Fig. A.1.) IRAS F06295-1735 (ESO 557-G002): the continuum image of this barred spiral shows vertical strips, which were not possible to remove during the reduction process (see Rodríguez-Zaurín et al. 2011). However, the Hα maps are not affected by this problem. Interestingly, neither the arms nor the bar in the Hα image coincide with those in the continuum image. The velocity field shows a regular structure, while its velocity dispersion map reaches the highest values (i.e., σ ~ 70–80 km s-1) at about 2 kpc to the south of the nucleus, in a region of relatively low emission. The scale is of 0.431 kpc/′′.
Current usage metrics show cumulative count of Article Views (full-text article views including HTML views, PDF and ePub downloads, according to the available data) and Abstracts Views on Vision4Press platform.
Data correspond to usage on the plateform after 2015. The current usage metrics is available 48-96 hours after online publication and is updated daily on week days.
Initial download of the metrics may take a while.