Fig. A.14
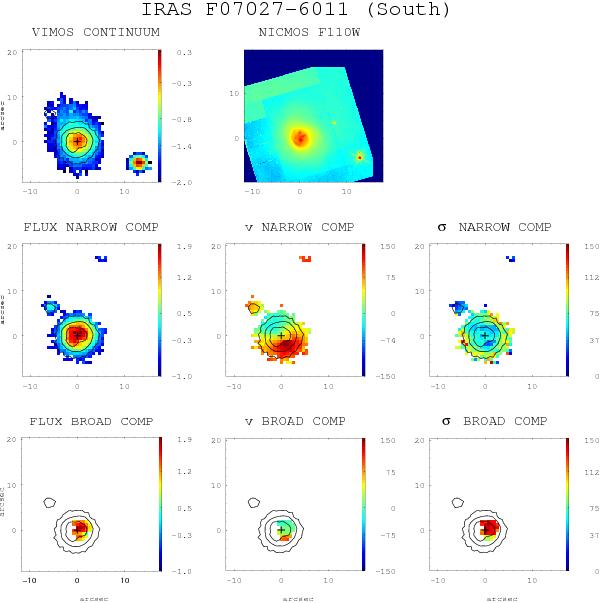
(General comments about the panels as in Fig. A.1.) IRAS F07027-6011 (AM 0702-601): these maps correspond to the southern galaxy of the system. The velocity field of the narrow component is rather regular. In the velocity dispersion map a local maximum is found in correspondence of the nucleus (or Hα peak). The spatial scale is of 0.626 kpc/′′.
Current usage metrics show cumulative count of Article Views (full-text article views including HTML views, PDF and ePub downloads, according to the available data) and Abstracts Views on Vision4Press platform.
Data correspond to usage on the plateform after 2015. The current usage metrics is available 48-96 hours after online publication and is updated daily on week days.
Initial download of the metrics may take a while.