Fig. A.26
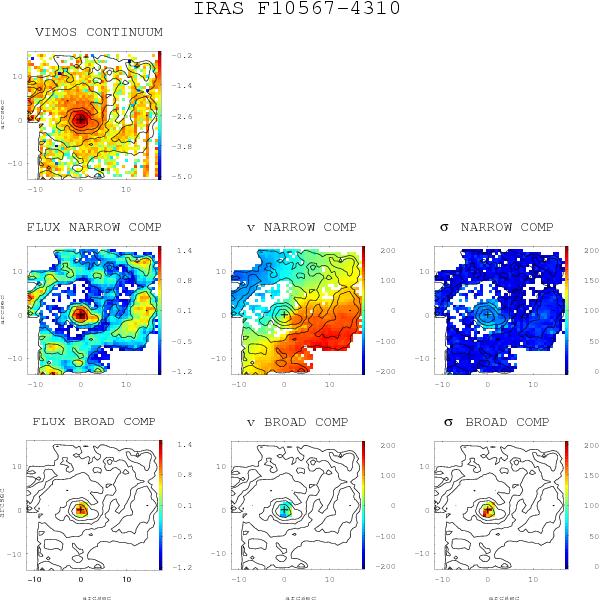
(General comments about the panels as in Fig. A.1.) IRAS F10567-4310 (ESO 264-G057): the continuum image shows vertical patterns, which were not possible to remove during the reduction process (see Rodríguez-Zaurín et al. 2011). However, the Hα maps are not affected by this problem. The narrow component shows a very regular velocity field and a centrally peaked velocity dispersion map. This object has been analyzed in Bellocchi et al. (2012). The scale is 0.35 kpc/′′.
Current usage metrics show cumulative count of Article Views (full-text article views including HTML views, PDF and ePub downloads, according to the available data) and Abstracts Views on Vision4Press platform.
Data correspond to usage on the plateform after 2015. The current usage metrics is available 48-96 hours after online publication and is updated daily on week days.
Initial download of the metrics may take a while.