Fig. A.21
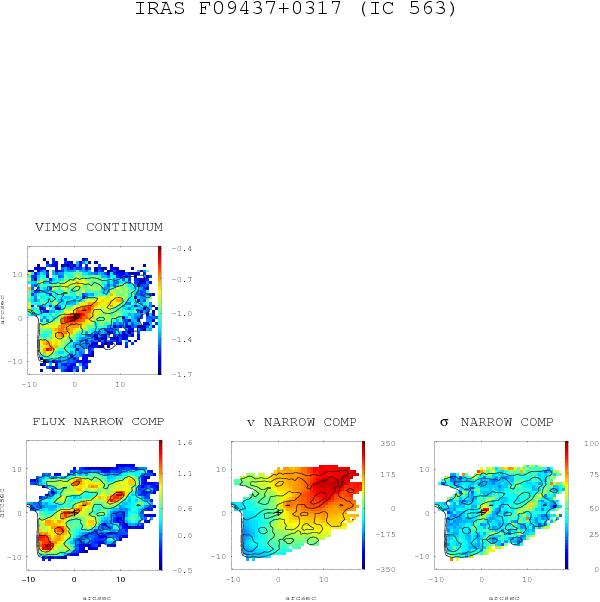
(General comments about the panels as in Fig. A.1.) IRAS F09437+0317 (IC 563): this object shows a very regular velocity field and a centrally peaked velocity dispersion map. The VIMOS continuum image is considered the center of the image since the Hα peak is offset due to a knot of star formation and does not properly define the center. The spatial scale is 0.415 kpc/′′.
Current usage metrics show cumulative count of Article Views (full-text article views including HTML views, PDF and ePub downloads, according to the available data) and Abstracts Views on Vision4Press platform.
Data correspond to usage on the plateform after 2015. The current usage metrics is available 48-96 hours after online publication and is updated daily on week days.
Initial download of the metrics may take a while.