| Issue |
A&A
Volume 709, May 2026
|
|
|---|---|---|
| Article Number | A134 | |
| Number of page(s) | 17 | |
| Section | Extragalactic astronomy | |
| DOI | https://doi.org/10.1051/0004-6361/202555982 | |
| Published online | 12 May 2026 | |
Outflowing shocked gas dominates the NIR H2 emission from the dual AGN NGC 6240
1
Institute of Theoretical Astrophysics, University of Oslo, P.O. Box 1029 Blindern 0315, Oslo, Norway
2
European Southern Observatory (ESO), Karl-Schwarzschild-Strasse 2, D-85748 Garching, Germany
3
Section of Astrophysics, Astronomy & Mechanics, Department of Physics, National and Kapodistrian University of Athens, University Campus Zografos, GR 15784 Athens, Greece
4
INAF – Osservatorio Astronomico di Brera, Via Brera 28, 20121 Milano, Italy
5
Dipartimento di Fisica e Astronomia Augusto Righi, Università degli Studi di Bologna, Via Gobetti 93/2, 40129 Bologna, Italy
6
INAF – Osservatorio di Astrofisica e Scienza dello Spazio di Bologna, Via Gobetti 101, 40129 Bologna, Italy
7
ASTRON, The Netherlands Institute for Radio Astronomy, Oude Hoogeveensedijk 4, 7991 PD, Dwingeloo, The Netherlands
8
Kapteyn Astronomical Institute, P.O. Box 800, 9700 AV, Groningen, The Netherlands
9
Department of Physics & Astronomy, University of South Carolina, Columbia, SC 29208, USA
★ Corresponding author: This email address is being protected from spambots. You need JavaScript enabled to view it.
Received:
17
June
2025
Accepted:
13
March
2026
Abstract
We present a multi-line study of the kinematics of the molecular and ionised gas phases in the central ∼2 kpc of the luminous infrared galaxy and dual active galactic nucleus (AGN) NGC 6240, based on archival JWST/NIRSpec and ALMA observations. Since a primary goal of our analysis is to study outflows, we devised a new spectral-line fitting approach to de-blend rotating and non-rotating gas components in the observed near-infrared (NIR) emission lines. Our method is more physically motivated than previous approaches and better tailored to the extreme feedback mechanisms at work in NGC 6240. We find that ∼65% of the Paα, H2, and [FeII] line fluxes within the NIRSpec field of view arise from gas components that are kinematically decoupled from the stars. In particular, the NIR H2 lines show the most deviation from the stars, with peak emission between the two rotating stellar structures. The polycyclic aromatic hydrocarbon (PAH) emission feature at 3.3 μm does not follow the NIR H2 morphology, indicating that the latter does not trace photon-dominated regions. In the non-rotating gas components, we identified a bi-conical wind that launched from the northern AGN, expanding along the minor axis of stellar rotation. This wind is dominated by ionised gas and, although it entrains some H2 gas, it does not show a H2/PAH enhancement, suggesting either high UV irradiation or expansion along a relatively gas-free path. Furthermore, we find bright non-rotating gas emission between the two AGNs and around the southern AGN, which we interpret as due to an outflow that launched from the southern nucleus, coinciding with the massive molecular outflow previously studied in cold (sub-)millimetre tracers. The strong H2/PAH enhancement measured in this region, coextensive with high velocity redshifted gas (v ∼ 900 km s−1), suggests that the shocks responsible for the high H2/PAH ratios are due to the outflow rather than to the collision of media during the merger. Our results show that most of the NIR line emission in NGC 6240 is decoupled from the stars, and that most of the warm H2 is shock-excited and embedded in a powerful outflow, where it coexists with colder molecular gas.
Key words: galaxies: active / galaxies: evolution / galaxies: interactions / galaxies: individual: NGC 6240 / galaxies: kinematics and dynamics / galaxies: nuclei
© The Authors 2026
 Open Access article, published by EDP Sciences, under the terms of the Creative Commons Attribution License (https://creativecommons.org/licenses/by/4.0), which permits unrestricted use, distribution, and reproduction in any medium, provided the original work is properly cited.
This article is published in open access under the Subscribe to Open model. This email address is being protected from spambots. You need JavaScript enabled to view it. to support open access publication.
1. Introduction
Major mergers play an important role in galaxy evolution by providing fuel for starbursts and accreting supermassive black holes (SMBHs) (Mihos & Hernquist 1996). Quasar activity and the creation of elliptical galaxies are also believed to be caused by mergers (Engel et al. 2010). In the local Universe (z ≤ 0.2), ultra-luminous infrared galaxies (ULIRGs), defined by their high infrared (IR) luminosity LIR(8 − 1000 μm) ≥ 1012 L⊙ (Sanders & Mirabel 1996), correspond to gas- and dust-rich major galaxy mergers (Lonsdale et al. 2006). The combination of a starburst and/or an active galactic nucleus (AGN) in a dust-enshrouded environment is thought to be responsible for their IR luminosity (Sanders et al. 1988; Veilleux et al. 2009). Studying the local ULIRG population is crucial to gain insights into such a short-lived, but potentially disruptive, phase of galaxy evolution. During this phase, galaxies experience intense merger-driven starburst and quasar activity and, consequentially, their interstellar medium (ISM) is subject to strong radiative and mechanical feedback mechanisms (Pérez-Torres et al. 2021; U 2022). A clear manifestation of such feedback is galactic-scale (e.g. kiloparsec-scale) outflows. Indeed, the energy released by AGNs and starbursts drives massive outflows, which can reduce the star formation rate (SFR) and accretion onto the central SMBH. In ULIRGs, outflows are powerful, multi-phase, and dominated in mass by cold molecular gas (Sturm et al. 2011; Aalto et al. 2012; Spoon et al. 2013; Veilleux et al. 2013; Cicone et al. 2014, 2020; Veilleux et al. 2020; Fluetsch et al. 2021). Massive molecular outflows have an incidence of > 70% in ULIRGs (Veilleux et al. 2013; Lamperti et al. 2022).
It is generally accepted that mergers of two massive galaxies lead to the formation of systems of SMBH pairs, initially at kiloparsec and sub-kiloparsec separations (dual SMBHs) and, as the galaxies coalesce, reaching down to parsec and sub-parsec separations (binary SMBHs) (Begelman et al. 1980; Merritt & Milosavljević 2005). Through the accretion of the surrounding gas, one or both SMBHs may shine as AGNs (Dotti et al. 2007), and thus be detectable via their electromagnetic signals. When both SMBHs in a pair are simultaneously active, we refer to the system as a dual or binary AGN, depending on the physical separation of the pair members (De Rosa et al. 2019; Rubinur et al. 2019). The search for dual and binary AGNs has recently gained more consideration, driven by the potential of current and future gravitational wave (GW) experiments (Colpi et al. 2024; EPTA Collaboration et al. 2023) of detecting signals emitted by these systems. Being the recent product of major mergers, local ULIRGs are expected to harbour dual SMBHs. However, confirming their presence can be particularly difficult due to several factors: the higher nuclear dust obscuration of these sources (Ricci et al. 2021), the expected low percentage of simultaneously accreting SMBHs detectable as dual AGNs (Van Wassenhove et al. 2012), and the scarcity of multi-wavelength data coverage with sufficient angular resolution to distinguish the pair members and confirm the AGN nature. As a result, only a few ULIRGs host confirmed dual AGNs, and the target of our study, NGC 6240, is the best-studied case.
NGC 6240 results from the collision of two gas-rich galaxies of a similar mass (Fosbury & Wall 1979). The merger geometry tends towards coplanar and prograde, and the source is captured between first encounter and coalescence stage (Engel et al. 2010). Although formally classified as a LIRG with LIR(8 − 1000 μm) = 1011.7 L⊙ (Liu et al. 2021), NGC 6240 is often considered a bona fide ULIRG (Genzel et al. 1998). It hosts two confirmed AGNs with a projected separation between 1.5″ and 1.8″ (800–900 pc) at X-ray (Komossa et al. 2003; Nardini et al. 2013) and radio wavelengths (Hagiwara et al. 2011). The two AGNs reside at the centres of two stellar rotating structures, identified by several authors (Engel et al. 2010; Ilha et al. 2016; Kollatschny et al. 2020), and most recently by Ceci et al. (2025) using the same JWST data used in this work. The sub-millimetre/millimetre (hereafter, (sub-)mm) continuum, tracing thermal cold dust emission, shows two distinct peaks near the AGN positions (Treister et al. 2020; Scoville et al. 2015).
The morphology and kinematics of the molecular gas in NGC 6240 are puzzling, and, to a large extent, inconsistent with expectations from current hydrodynamical simulations of galaxy mergers. Indeed, unlike ionised gas tracers, none of the molecular emission lines explored so far, such as CO, [CI], HCN, CS, HCO+ transitions at (sub-)mm wavelengths (Tacconi et al. 1999; Iono et al. 2007; Scoville et al. 2015; Feruglio et al. 2013a; Cicone et al. 2018), and near-IR (NIR) H2 ro-vibrational lines (Herbst et al. 1990; van der Werf et al. 1993), present two distinct surface brightness peaks, as it would be expected if the H2 gas followed the dust and stellar distributions. Instead, all H2 tracers in NGC 6240 hint at a high concentration of gas in the internuclear region between the two AGNs. This structure is elongated towards the south, almost reaching the southern AGN in the (sub-)mm lines, with a clear peak near the southern AGN in the NIR H2(1-0) S(1) line (Max et al. 2005). This line is exceptionally bright in NGC 6240 (Goldader et al. 1995). Max et al. (2005) suggested the central molecular gas structure of NGC 6240 to be a bridge connecting the two nuclei, possibly tracing gas flowing from one nucleus to another (see also Treister et al. 2020). Tacconi et al. (1999) interpreted the bright CO-emitting nuclear reservoir as a rotating and highly turbulent molecular gas disc, but this hypothesis is inconsistent with the presence of two stellar discs around the nuclei and has been ruled out by high-resolution data (Treister et al. 2020; Johnstone et al. 2025).
The molecular gas properties of NGC 6240 must be analysed within the framework of the powerful and disruptive feedback processes at work in this source. Ionised gas outflows are a clear manifestation of such feedback, and include bi-conical or conical winds, bubbles, (Müller-Sánchez et al. 2018; Ceci et al. 2025; Hermosa Muñoz et al. 2025), and a superwind expanding into the circumgalactic medium detected in Hα (Heckman et al. 1990; Armus et al. 1990; Gerssen et al. 2004; Veilleux et al. 2003; Yoshida et al. 2016), and soft X-ray emission (Nardini et al. 2013). In addition, NGC 6240 hosts a massive outflow of molecular gas. The latter was first suggested by high-velocity components of the H2 1-0 S(1) emission line (van der Werf et al. 1993; Ohyama et al. 2000, 2003), and then unambiguously confirmed through highly blue-shifted (vmax = −1200 km s−1) OH absorption (Veilleux et al. 2013) and high sensitivity, wide bandwidth CO line observations (Feruglio et al. 2013a,b). Its properties are extreme even compared to other massive molecular outflows detected in local ULIRGs: it extends by more than 10 kpc along the east-western direction, it entrains > 1010 M⊙ of H2 gas, i.e. ∼60% of the cold molecular gas reservoir of the system, and it dominates the cold gas kinematics in the central 1–2 kpc (Cicone et al. 2018).
Here we present a new analysis of the morphology and kinematics of molecular and ionised gas tracers in NGC 6240, primarily based on public archival JWST NIRSpec observations recently presented by Ceci et al. (2025) and supplemented with ALMA data from Cicone et al. (2018) and from the public archive. Differently from Ceci et al. (2025), we do not rely on an arbitrary decomposition of narrow and broad spectral line components to identify outflow features. We devise a more physically motivated approach that exploits the kinematic parameters derived from the stellar fit to disentangle disc and non-disc components in the gas tracers. As we discuss in the paper, this method allows us to discover significant additional H2 components entrained in the outflow and to recognise a striking overlap between the cold and warm phase of the massive molecular outflow in NGC 6240, providing further clues to its origin.
Throughout this paper, the cosmology is the standard ΛCDM model with H0 = 67.8 km s−1 Mpc−1, Ωm = 0.308, and ΩΛ = 0.692. At the distance of NGC 6240 with redshift z = 0.02448 and luminosity distance DL = 110.3 Mpc, the physical scale is 0.509 kpc arcsec−1.
2. Data
2.1. Archival JWST NIRSpec observations
Our analysis relies on the NIR integral field unit (IFU) observations of the nuclear region of NGC 6240, collected with the JWST/NIRSpec instrument as part of the Guaranteed Time Observations (GTO) program 1265 (PI: A. Alonso-Herrero), on July 17, 2023. The data reduction was done using the JWST pipeline v1.14.0 with CRDS context 1242. The point-spread function (PSF) of NIRSpec is 0.08″ (Jakobsen et al. 2022). We gathered the combined science (stage 3) data products from the MAST web portal1.
Three high-resolution (R ∼ 2700) grating/filter configurations were used: G140H/F100LP covering the wavelength range 0.97–1.89 μm, G235H/F170LP covering 1.66–3.17 μm, and G395/F290LP covering 2.87–5.27 μm. We refer to these configurations as the 1.0 μm band, 1.7 μm band, and 2.9 μm band, respectively. Each band has an effective integration time of 219 seconds. In Fig. 1, we show a composite image of the NIRSpec field-of-view (FoV) (5.1″ × 4.5″, i.e. 2.5 kpc × 2.3 kpc), where the red, green, and blue channels correspond to wavelengths around 1.6, 2.9, and 4.6 μm, respectively. The spaxel size is 0.1″ × 0.1″. Four apertures with 0.3″ radius are shown, covering the northern (N) and southern (S) nuclei (hereafter, N AGN and S AGN), a region offset to the east of the two nuclei (OE), and a central (C) region between them. The two AGNs are marked using the Very-Long-Baseline Interferometry (VLBI) positions from Hagiwara et al. (2011).
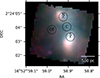 |
Fig. 1. RGB composite map of NGC 6240 obtained with JWST NIRSpec, tracing the emission at ∼1.6 μm (blue), 2.9 μm (green), and 4.6 μm (red). Four representative apertures with 0.3″ radius are shown on the map: the VLBI positions (Hagiwara et al. 2011) of the two known AGNs (N and S) at RA = 16h52m58s.9241, Dec = 02° 24′04″.776, and RA = 16h52m58s.8902, Dec = 02° 24′03″.350 respectively; a central position between the nuclei (C), at RA = 16h52m58s.907, Dec = 02°24′4″.063, and an offset point to the east (OE), at RA = 16h52m58s.978, Dec = 02°24′3″.859. The physical scale of the map (500 pc) is indicated by the white line. |
We performed an astrometric corrections to all three bands, following Ceci et al. (2025), who analysed the same data. We assumed that the 4.5 μm continuum peak coincides with the S AGN, the brighter one. The correction offsets applied to the data were δRA = −0.22″ and δDec = 0.17″. After the correction, both nuclei are consistent with the VLBI AGN positions.
As a result of the under-sampling of the PSF, NIRSpec IFU single-spaxel spectra close to bright point sources often display sinusoidal artefacts commonly referred to as wiggles. Although more pronounced in data cubes with spaxel size of 0.05″, these artefacts also partially affect our data. More specifically, we detected wiggles over an approximately circular area centred on the S AGN with r ∼ 0.2″ − 0.3″ (see top-right panel of Fig. A.1), but not in other portions of the FoV. We tested the possible impact of the wiggles on the results of our spectral fitting procedure (described in Sect. 3.3) in the most severely affected spaxel at the S AGN position, and found no statistically significant effect. We also repeated the whole analysis by masking the 15 spaxels that are affected by wiggles, which are all around the S AGN. The resulting line fits and flux maps remained unchanged within the uncertainties, and did not affect any of the conclusions presented in this work. We note that all wiggle correction techniques in use in the literature (e.g. Perna et al. 2023) rely on modelling the wiggles from the same scientific dataset under study. Such an empirical approach may not deliver perfect results (see Ceci et al. 2025). It is especially risky in our case, where extended emission from gas and stars overlaps with the point sources; thus, the only point-source spectrum available in our dataset near the S AGN, which should be used to model the wiggles, displays line wings of physical origin, due to known widespread outflows, as well as stellar absorption lines. For all these reasons, we decided not to perform a wiggle correction on our data.
2.2. Archival ALMA observations
2.2.1. Band 7 (870 μm) continuum data
We used the high-resolution data available in the ALMA archive as part of project ID 2013.1.00813.S (PI: Rangwala). In particular, we used the ALMA Science data model (Asdm) uid://A002/Xa8df68/X101b. The calibrated measurement set (MS) was kindly provided upon request by the ALMA European ALMA Regional Center. The observations were taken with 41 antennas of the ALMA 12 m array on 27 August, 2015, with a precipitable water vapour (PWV) of 0.813 mm. The total observing time was 28 minutes, and the on-source time on NGC 6240 was a little over 3 minutes. The following sources were used as calibrators: J1733-1304 (Bandpass), Ceres (Amplitude, Flux), J651+0129 (Phase), J1649+0412 (Delay).
From this dataset, we produced a map of the 870 μm dust continuum in the nuclear region of NGC 6240, with an angular resolution comparable to that of JWST NIRSpec. The (sub-)mm spectrum of NGC 6240 is chemically rich, and most species are bright and so detectable by ALMA even with short exposures. Moreover, due to the massive molecular outflow (see Sect. 1), most molecular transitions in this source show broad wings, so one has to worry about line contamination even in spectral channels that are distant from the central frequency of a line. We thus imaged and visually inspected each spectral window to select the line-free channels for continuum imaging. Besides the obvious contamination from the broad CO(3-2) line (at νobs = 337.5 GHz) that occupies most of spw 2 and part of spw 3 of this dataset, we found a possible signature of contamination from other species such as HCO+(4-3) and SiO(8-7). We finally conservatively selected the line-free channels using the CASA task split, i.e.: νobs ∈ (349.5, 350.4) GHz in spw 0, νobs ∈ (350.3, 351.9) GHz in spw 1, and νobs ∈ (339.5, 340.2) GHz in spw 3. We then imaged the corresponding uv visibilities using the task tclean with specmode = mfs, using a hogbom deconvolver, with briggs weighting (robust = 0.5). We used a cleaning mask centred at RA = 16h52m58.91s, Dec = 02d24m03.89s with a radius of 1.3 ″. The cell size is 0.05″. The resulting map has a synthesised beam of 0.315″ × 0.14″ (PA = − 65.7 deg). We applied a primary beam correction using the impbcor task. The final sensitivity of the map is 0.3 mJy/beam (1σ RMS). We note that the same data were used by Fyhrie et al. (2021) and their Band 7 continuum map is consistent with the one produced by us.
2.2.2. Band 8 [CI]3P1−3P0 line data
The ALMA Band 8 data from project ID 2015.1.00717 (PI: Cicone) enable us to compare the morphology of the cold molecular outflow as imaged using the atomic carbon [CI]3P1−3P0 line (hereafter, [CI](1-0)) with that of the warm molecular hydrogen observed by JWST. We used the same ALMA maps as shown in Cicone et al. (2018) (panels c and d of Figure 1 in that paper), which were obtained by integrating the [CI](1-0) line emission respectively between (−650, −200) km s−1 (blue wing) and (250, 800) km s−1 (red wing). We refer to that paper for technical details about these observations as well as the analysis that led to the computation of the molecular outflow properties. The synthesised beam of the ALMA [CI](1-0) maps is 0.29″ × 0.24″ (PA = 113.2 deg).
2.2.3. Band 3 CO(1-0) line data
To strengthen our comparison between the cold phase of the molecular gas and the warm phase traced by the NIR H2 lines, we also used the ALMA Band 3 CO(1-0) line data from project ID 2015.1.00003.S (PI: Saito). The calibrated MS was provided by the ALMA European ALMA Regional Center. The Asdm is uid://A002/Xb68dbd/X72f9. The observations were taken with 37 antennas of the 12 m ALMA array on 16 Aug. 2016 with excellent weather conditions for Band 3 (PWV = 0.57 mm). The total observing time was 28 minutes, and the on-source time on NGC 6240 was 10 minutes. The following sources were used as calibrators: J1550+0527 (bandpass), Titan (flux), J1651+0129 (Phase). We focused the analysis on spw 0, which covers the CO(1-0) line centred at νobs = 112.52 GHz. The native spectral resolution of the data is δvres = 2.6 km s−1. We used the task uvcontsub to fit the continuum emission with a first-order polynomial and to subtract it from the uv visibilities. The frequency ranges selected to estimate the continuum level were νobs ∈ (111.6, 112.1) GHz and νobs ∈ (113, 113.4) GHz. We imaged the continuum-subtracted visibilities using tclean, specmode=cube, re-binning the data using a channel width of 5. We selected the hogbom deconvolver and used Briggs weighting with robust = 0.5. The mask was defined using interactive cleaning to adjust it to the extent of the source, which varies for different channels. The cell size is 0.08″, and the resulting synthesised beam is 0.55″ × 0.52″, PA =−52.8 deg. The spectral bandwidth covers a velocity range of (−2521, 2462) km s−1. The average line sensitivity is 0.6 mJy/beam per 13 km s−1 channel.
3. Results
3.1. Spectral properties
We extracted the NIR spectra from positions N, S, OE, and C (see Fig. 1) using apertures with radius 0.3″. These are shown in Fig. 2, together with a total spectrum extracted from the full FoV. The flux densities were normalised and scaled relative to the peak of the total spectrum for visual purposes and the spectra are shown in rest-frame wavelengths, using z = 0.02448. The three gaps in the spectra correspond to the gaps between the NIRSpec detectors. We identified several emission lines, marked with dashed vertical lines, most of which are ro-vibrational and purely rotational lines of molecular hydrogen (H2, see Table A.1). The polycyclic aromatic hydrocarbon (PAH) emission feature at 3.3 μm is prominent in all spectra. We marked three stellar CO absorption regions: (i) from CO(3-0) to CO(8-5) at λ= 1.5528–1.6610 μm; (ii) from CO(2-0) to CO(3-1) at λ= 2.2935–2.3739 μm; and (iii) from CO(1-0) R(22) to P(19) at λ= 4.5010–4.9486 μm. We have also identified the CO2 bending-vibrational mode at 4.27 μm. The comparison between the spectra in Fig. 2 shows: (i) significantly weaker ro-vibrational and rotational H2 lines at both AGN positions compared to regions C and OE; (ii) a flat or even slightly rising continuum at λ > 3.5 μm in the AGN spectra, whereas the opposite is true for the C and OE spectra; (iii) stronger Paα and Brγ emission in the N AGN compared to the other spectra; and (iv) weaker [FeII] emission in the S AGN than in the other regions. Such spatial variations are further explored in the analysis that follows, which focuses mainly on the kinematics and morphology of the following tracers: Paα, Paβ, H2 1-0 S(1), H2 0-0 S(8), [FeII] λ1.257 μm, and [FeII] λ1.644 μm, as well as PAH 3.3 μm. A detailed NIR spectral analysis is beyond the scope of this paper, as it was already done by Ceci et al. (2025).
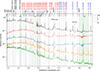 |
Fig. 2. Relative intensity of spectra extracted using an aperture of 3 spaxels from the northern (N) and southern (S) nuclei, a centre (C) point between the AGNs, an offset (OE) point (see Fig. 1), and the full FoV (Total). The spectra are joined from the three JWST/NIRSpec grating/filter compositions to cover all the wavelengths. CO bands are marked as shaded regions. Atomic lines are annotated in black, ro-vibrational H2 transitions in red, and pure rotational H2 transitions in blue. |
3.2. Stellar kinematics
We fitted a stellar continuum to the data using the penalised pixel-fitting routine (pPXF) (Cappellari & Emsellem 2004; Cappellari 2017). We used the E-MILES stellar population synthesis templates (Vazdekis et al. 2016), which cover the wavelength range 0.168 − 5 μm at a spectral resolution of 2.51 − 23.57 Å. Since the shape of the stellar continuum varies between the bands, we adopted different orders of Legendre polynomials to correct the shape during the fit. We used a fifth-order additive and a second-order multiplicative Legendre polynomial for the 1.0 μm band. We also used a fifth-order additive polynomial for the 1.7 μm band, with a third-order multiplicative polynomial to account for the shape variations. The 2.9 μm band is difficult, as there are few stellar features for pPXF to work with. We attempted a fit with a sixth-order additive and a third-order multiplicative polynomial, but the comparison with the results obtained in the other two bands indicates that the stellar fit results are unreliable at these longer wavelengths.
In Fig. 3, we present the stellar velocity and velocity dispersion maps obtained using pPXF for the 1.0 μm and 1.7 μm bands. In the maps, we marked the positions of six representative spaxels across the FoV (including the two nuclei) characterised by different levels of S/N, for which we show examples of pPXF spectral fits in Fig. A.1. The resulting stellar moment maps are consistent with previous studies (e.g. Ceci et al. 2025; Engel et al. 2010; Ilha et al. 2016; Kollatschny et al. 2020), especially those obtained from the 1.7 μm band data which we deem to be more reliable thanks to the availability of numerous stellar features. The rightmost panel of Fig. 3 shows the result of a fit to the 1.7 μm band stellar maps with the kinemetry tool (Krajnović et al. 2006), obtained by selecting the VLBI positions of the two AGNs as kinematic centres. Such kinemetry fit is shown only for better visualising the structure and orientation of the two stellar rotating structures, and it is not used in the analysis that follows. Engel et al. (2010) already performed a detailed analysis of the stellar dynamics, exploring different choices of kinematic centres and using data with a higher spectral resolution.
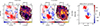 |
Fig. 3. Analysis of the stellar dynamics, showing the presence of two rotating structures. The left and middle panels show respectively the stellar velocity and velocity dispersion maps obtained from the 1.0 μm and 1.7 μm bands using pPXF (we note that the colour bars have different limits). The points N, S, C, and OE indicated on the maps are the same as Fig. 1. The other two positions are centred at RA = 16h52m58s.829, Dec = 02°24′4″.369 (ONW) and RA = 16h52m58s.863, Dec = 02°24′2″.331 (OSW). Examples of pPXF spectral fits are presented in Fig. A.1. The right panel shows the major axis PA (dashed grey lines) for the two stellar structures derived using the kinemetry tool (Krajnović et al. 2006). The two AGNs, marked with crosses, are used as kinematic centres. The northern PA is 26.5 ± 3.2°, and the southern PA is 153.0 ± 0.5°. Angles are measured anti-clockwise from the north. |
Fig. 3 confirms the presence of velocity gradients suggestive of two distinct rotating structures centred at the N and S nuclei. According to Engel et al. (2010), their properties are consistent with the (pseudo-)bulges of the progenitor merging disc galaxies. As already pointed out by previous studies, the stellar velocity dispersion does not display any clear peak at the expected dynamic centres. However, especially in the 1.7 μm band map, we can identify regions of high σv between the S AGN and position C, with peak values of σv > 350 km s−1. Although the limited spectral resolution of the JWST data demands some caution, a similar enhancement of σv at the northern side of the southern stellar pseudo-bulge is visible in the stellar moment maps reported by Engel et al. (2010). These were obtained with the SINFONI instrument at the Very Large Telescope (VLT) equipped with adaptive optics and delivering an angular resolution of 0.10″ × 0.16″. These authors demonstrated that the σv > 330 km s−1 values can be the consequence of a single-kinematic component fit performed on data where absorption features from two stellar populations at different relative line-of-sight velocities are blended. The two likely populations are the southern progenitor’s stars and younger stars formed during the collision. Their estimates indicate that about 6% of the extinction-corrected luminosity in this central region of NGC 6240 may trace a younger stellar population formed outside of the progenitor’s pseudo-bulge.
3.3. Spectral line fitting
In Sect. 3.2 we showed that the stellar light of NGC 6240 within the NIRSpec FoV is dominated by two rotating structures, one around each nucleus. In addition, we know from previous works that NGC 6240 hosts a powerful multi-phase galactic outflow, embedding significant molecular gas. As pointed out by several studies, the massive H2 outflow is probably the reason why, contrary to ionised gas tracers and to the stellar component, all molecular tracers in this source display a surface brightness peak between the two nuclei and do not show clear signs of rotation (see Sect. 1).
A primary goal of our analysis is to disentangle the gas components involved in the outflow from those that are not. To do so, we cannot rely on standard disc modelling procedures followed by a study of residual emission: such approach is valid for sources where disc-like rotation dominates the gas emission, but this is not NGC 6240’s case. Another approach could be a narrow and broad spectral line decomposition such as the one adopted by Ceci et al. (2025). However, we note that this commonly used method relies on the assumption that the majority of the flux from a given emission line is in a narrow spectral component tracing a rotating and/or disc structure, while secondary broad and/or high-velocity components trace an outflow (or other non-rotating structures). This assumption may be valid for less extreme galaxies, but it does not hold for NGC 6240, where most of the line emission, especially from molecular gas tracers, does not trace rotation. It is instead likely that non-virial motions and, in particular, outflows, dominate the gas kinematics in the central ∼2 kpc of this galaxy (the NIRSpec FoV). This is supported by the highly blueshifted OH absorption (Veilleux et al. 2013) and by the CO and [CI] analysis presented in Cicone et al. (2018), which had the advantage of using (sub-)mm data with extremely high spectral resolution and S/N. Further confirming this hypothesis, an inspection of the moment maps divided into narrow and broad components presented by Ceci et al. (2025) for the [FeII], Paα, and H2 1-0 S(1) lines shows that: (i) their broad components maps appear like a lower S/N version of the narrow components maps, there are no clear kinematic differences between the two, indicating that the outflow has not been properly de-blended; (ii) none of the narrow component maps resemble the rotating pattern seen in the stars. In fact, the narrow velocity maps of all three gas tracers display a highly redshifted area between the two AGNs, a region where the rotating stellar structures are instead systematically blue-shifted. Not surprisingly, this is a region where the outflow brightness is maximum (see later Section 4), clearly proving that the outflow is not just contaminating, but it is even dominating the flux in the narrow components identified by Ceci et al. (2025).
We thus devised a new fitting approach to disentangle rotating from non-rotating motion that relies on the results of the stellar kinematics fit. Given the gas-rich nature of the progenitor disc galaxies involved in the merger, and the rotation pattern dominating the stellar kinematics, we assumed that there must be some gas coupled with the stars in such rotating structures. This assumption is supported by the detection of spatially concentrated (sub-)mm dust emission around both AGNs, which implies the presence of ∼108 M⊙ and ∼8 × 10⁸ M⊙ of circumnuclear molecular gas at r ≲ 40 pc (Medling et al. 2019). These scales are well within the stellar rotating structures. CO(2-1) emission was also detected on the same scales (Medling et al. 2019). Under this assumption, we tied one spectral component of the gaseous emission lines to the stellar kinematics, forcing it to share the same velocity and velocity dispersion as the stars (on a spaxel-by-spaxel basis) within their 3σ uncertainty derived from pPXF. Up to two additional emission line components accounted for the gas emission that is decoupled from the stars. Assuming the same σv of rotation for gas and stars is a limitation of this approach: however, given the low spectral resolution of the NIRSpec data, and the absence of a clear outflow-free region in the FoV that would allow us to isolate the gas involved in the rotation and measure its σv (without the outflow contamination), this is the best that can be done for this source. Furthermore, assuming that, in each spaxel, each stellar component has an associated gas component, may lead to overestimating the fraction of gas coupled with the stars, and consequently underestimating the fraction of gas not involved in stellar motions. Still, this is a clear improvement from the common practice of using only the high-velocity wings of emission (or absorption) lines to trace outflows or inflows, which leads to severe underestimation of these components. Despite its limitations, our methods are more physically motivated and more tailored to the complex morphology and kinematics of a major galaxy merger such as NGC 6240. We note that a similar approach was successfully implemented by Hagedorn et al. (2026) to study the multiphase outflow in IRAS 20100-4156.
Henceforth, we define the gas component that is kinematically coupled to the stars as ‘rotating’, as opposed to ‘non rotating’ components. We note that this is an oversimplification, because by construction these components account for any motion with a stellar counterpart in the NIRSpec bands. For example, gas-rich stellar tidal tails and similar merger-related features are included among such rotating components. The high dispersion (σv > 350 km s−1) region between the two AGNs discussed at the end of Sect. 3.2 is one of such cases.
For the purpose of separating rotating and non-rotating components, we selected six bright and representative emission lines from the rich NIR spectrum of NGC 6240 and fitted them on a spaxel by spaxel basis, using the lmfit Python package for non-linear curve fitting (Newville et al. 2024). We chose two hydrogen recombination lines (Paα & Paβ), two iron lines ([Fe II] λ1.257 μm & [Fe II] λ1.644 μm), and two molecular hydrogen lines: one ro-vibrational (H2 1-0 S(1)) and one pure rotational (H2 0-0 S(8)). Table 1 reports the central wavelengths and the spectral regions considered during the fits. We performed an S/N-cut by taking the median of the intensity at each spaxel and only choosing the spaxels with S/N > 10. Then, each spectrum was fitted using a compound model consisting of up to three Gaussian functions and one linear function. As described above, one Gaussian shared similar v and σv as the stellar absorption features in that given spaxel as obtained from pPXF, with values that were allowed to vary up to within 3 times the 1-sigma error-bars derived from pPXF. The other (one or two) Gaussians were free to trace the remaining spectral emission arising from gas whose dynamics is not consistent with that of the stars. The linear function accounted for any baseline residuals after the stellar continuum subtraction.
Fitted emission lines.
The fit residuals were calculated as res. = w(data−fit), where w are the weights. We set the weights to be the inverse spectral RMS noise level. We set the minimisation optimizer to Powell’s method, a conjugate direction method, which we found to be better suited for multi-component spectral fitting with several local minima than the default optimizer (the Levenberg-Marquardt method). For each spaxel, we scaled the spectrum by the maximum intensity to avoid numerical instabilities while performing each fit. Table 2 reports the initial values and parameter bounds used in our fit. The spectral fit results for the selected spaxels marked in Fig. 3 are shown in Figs. A.2–A.7. The total line fluxes, integrated over the full NIRSpec FoV, are reported in Table 3, together with the line fluxes measured separately for the rotating and non-rotating components.
Initial parameters and parameter bounds used for the three Gaussian functions during the spectral line fitting.
Line fluxes measured from the fit.
3.4. The PAH 3.3 μm feature
When exposed to UV radiation, the Carbon-rich molecules consisting of tens to hundreds of Carbon atoms denominated polycyclic aromatic hydrocarbons (PAHs), get excited as the energy from UV photons is transferred to their vibrational levels. When cooling radiatively, PAHs produce strong, broad emission features at NIR and MIR wavelengths. The PAH 3.3 μm band, whose emission in NGC 6240 is prominent across the whole NIRSpec FoV (see Fig. 2), is dominated by smaller neutral molecules that are resilient to AGN radiation fields (Rigopoulou et al. 2024).
To produce a PAH 3.3 μm intensity map, we fitted this feature using two Gaussians: one for the PAH feature itself and one to account for the H2 1-0 O(5) emission line at 3.235 μm that is partially blended with the PAH feature. The spectral fit results are reported in the Appendix (Fig. A.8). In the left panel of Fig. 4 we show the map of the total integrated intensity of the PAH 3.3 μm feature, which peaks at the S AGN and extends in a peanut shape with a secondary peak near the N AGN. The PAH morphology differs from that of the gaseous tracers investigated in this paper, in particular from that of H2 line emission. The UV-pumped IR-fluorescence of PAH molecules potentially follows more closely the distribution of the (sub-)mm dust continuum, shown in the right panel of Fig. 4.
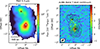 |
Fig. 4. Left panel: Intensity map of the PAH 3.3 μm band. The AGN positions are marked with crosses. Right panel: High resolution ALMA map of the 870 μm dust continuum, with overlaid PAH 3.3 μm contours. |
3.5. Total moment maps of gas tracers
Before analysing separately the rotating and non-rotating gaseous components decoupled by our spectral fit procedure, we first present in Fig. 5 the total 0th moment (intensity), the 1st moment (intensity-weighted velocity), and the 2nd (intensity-weighted velocity dispersion) maps of the six selected emission lines. These maps were computed considering the total line flux from these transitions, hence, rotational and non-rotational motions are blended in them.
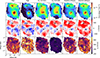 |
Fig. 5. Moment maps for six selected emission lines: two hydrogen recombination lines Paα and Paβ, two strong molecular hydrogen lines H2 1-0 S(1) and H2 0-0 S(8), and two ionised iron lines [Fe II] λ1.644 μm and [Fe II] λ1.257 μm. The zeroth moment is shown in the upper panel, the first in the middle, and the second in the lower panel. The AGN positions are marked with crosses. |
It is evident from the 1st moment maps in Fig. 5 that the gas kinematics do not resemble that of the stars. This implies that, in NGC 6240, the majority of the emission line luminosity, for both molecular and ionised gas tracers, probes gas motions that are decoupled from the stars. The Paschen lines show localised peaks near the nuclei, with a main peak in correspondence with the S AGN and a secondary peak slightly north-east of the N AGN. The northern intensity peak is coincident with a prominent blue-shifted component visible in both Paα and Paβ, and it is near a region of enhanced velocity dispersion in the Paα 2nd-moment map (the Paβ velocity dispersion map is too noisy to draw this conclusion). A possible higher-σv counterpart is also seen on the western side of the nucleus, in the Paα map. Such blue-shifted and high-σv features could be the signature of a bi-conical ionised wind launched from the northern nucleus in a direction aligned with the minor axis of stellar rotation, which is discussed in Sect. 4. Overall, the Paα and Paβ velocity maps are similar. The velocity dispersion of Paβ is much higher than for any of the other lines, which can be due to its lower S/N.
In the 0th moment maps of the H2 lines, the surface brightness is enhanced across an extended, approximately rectangular (1.0″ × 1.5″, i.e. 760 pc × 510 pc) region between the two AGNs, with a peak near the S AGN, a bit shifted to the east. The morphology is similar for both H2 lines. Such concentration in the internuclear region is a distinctive property of NGC 6240 and it is shared by all H2 tracers investigated so far (see Sect. 1). The velocity maps of the ro-vibrational and rotational H2 transitions are almost identical, with the N AGN embedded in redshifted gas with vH2 > 150 km/s, and the S AGN situated in a blue-shifted diagonal band in the south-eastern and north-western direction with vH2 ∼ −50 km/s.
The intensity maps of the two [FeII] lines show similar features as the two Paschen lines, with peaks near the two nuclei. However, the [FeII] velocity maps are dominated by redshifted gas, with a small region of blue-shifted gas north-east of the N AGN, similar to what is seen in Paα and Paβ. Akin to the other lines, the [FeII] gas is blue-shifted in the area surrounding the S AGN. The velocity dispersion map of both [Fe II] tracers shows similarities with the Paα moment-2 map.
3.6. Moment maps of non-rotating gas components
Our line fitting procedure, described in Sect. 3.3, allowed us to de-blend the non-rotating from the rotating components of the gas emission. We remind that the latter include by construction any component with a stellar counterpart in the NIRSpec data, such as merger-related features. The resulting moment maps are reported in Fig. 6 for the Paα, H2 1-0 S(1), and [Fe II] λ1.644 μm emission lines, i.e. the three transitions with the highest S/N and so the most reliable spectral fit results. As expected, the rotating components, presented in the left panels of Fig. 6, follow closely the stellar kinematics. The moment maps of the non-rotating components, presented in the right panels, are very similar to the total moment maps (Fig. 5). This indicates that rotation has a minor contribution to the NIR line emission in these central ∼2 kpc of NGC 6240. We found that, within the NIRSpec FoV, a rotating component accounts for 35.8 ± 0.4% of the Paα flux, 34.3 ± 1.1% of the H2 1-0 S(1) flux, and 35.5 ± 0.5% of the [Fe II] λ1.644 μm flux (see Table 3).
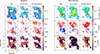 |
Fig. 6. Moment maps of rotating (left) and non-rotating (right) components of the Paα, H2 1-0 S(1), and [Fe II] λ1.644 μm emission lines. Only spaxels with S/N > 2 are plotted. The crosses indicate the AGN positions. |
The non-rotating component of Paα near the N AGN has a shape that is elongated approximately perpendicular to the major-axis of stellar rotation. Both the blue-shifted eastern side and the red-shifted western sides display a high velocity dispersion. This could already be distinguished (at a lower S/N) in the total moment maps in Fig. 5. We interpret this feature as a bi-conical wind expanding along the minor axis of rotation. We detected a similar feature in the non-rotating [Fe II] λ1.644 μm moment 2 map, with a faint counterpart also in the non-rotating H2 1-0 S(1) moment 2 map. Because of its characteristic geometry, its high-velocity dispersion of 400 km s−1, and because it is clearly decoupled from the stars, we suggest that this structure traces an AGN-driven wind entraining ionised gas and warm molecular gas, extending out to several 100s pc from the N AGN.
In the southern half of the FoV, around and south of the S AGN, the moment maps of the non-rotating components of all three lines show an extended area of enhanced velocity dispersion, characterised by blue-shifted velocities. This feature does not show a clear elongation or orientation with respect to stellar rotation, so it is hard to reconcile it with a classical bi-conical wind similar to that identified around the N AGN. We discuss it further in Sect. 4.
3.7. H2/PAH ratio map
Excess H2/PAH emission, by a factor of 10-100 compared to the disc, was found in the galactic outflow of M82 and explained with shock excitation (Beirão et al. 2015). In Fig. 7 we present the H2 0-0 S(8)/PAH 3.3 μm intensity ratio map of NGC 6240. We obtained similar maps when we computed the H2/PAH ratio using a ro-vibrational H2 line instead of H2 0-0 S(8). Both AGNs are located in regions where the H2/PAH ratio is low. This is due to the conjunction of PAH 3.3 μm being stronger at the positions of the AGNs (Fig. 4), and H2 emission being brighter between them. We can distinguish two low H2/PAH ratio (< 0.2) areas centred on the two AGNs, both extending away from the nuclear region, i.e. south of the S AGN as well as north and north-west of the N AGN. Interestingly, the AGN wind that we identified in the northern nucleus coincides with one of such low H2/PAH ratio zones. Between the AGNs, approximately 1″ south of the N AGN and slightly offset to the east, there is a compact region where the H2/PAH ratio peaks (> 0.75). The right panel of Fig. 7 displays the same H2 0-0 S(8)/PAH intensity ratio map where we overlaid as contours the red- and blue-shifted outflow emission from cold molecular gas as traced by the ALMA [CI](1-0) data from Cicone et al. (2018). The [CI](1-0) outflow, especially its redshifted side and its more extended blue-shifted eastern component, follows quite closely the north-western to south-eastern stripe of elevated H2-to-PAH ratio revealed by the JWST data. Remarkably, the [CI](1-0) red-wing peaks exactly on top of the H2/PAH ratio peak mentioned above.
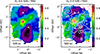 |
Fig. 7. Map of the intensity ratio between the rotational H2 0-0 S(8) line and the PAH 3.3 μm emission band. The contours in the right panel are the [CI](1-0) red- and blue-wing outflow emission from Cicone et al. (2018), corresponding to [3σ, 6σ, 15σ, 21σ] with σ = 1.1 mJy/beam for the red wing, and 1.0 mJy/beam for the blue wing. White crosses mark the AGN positions. |
Taken together, these results suggest that: (i) most of the H2 emission in the internuclear region does not arise from photon-dominated regions (PDRs), because in this case we should have detected a peak also in PAH emission due to the excitation of these molecules by UV photons; (ii) the excess H2 emission (responsible for the overall high H2/PAH ratio) originates in the outflow, and the outflow either does not contain PAH grains or, alternatively, it is shielded from UV radiation hence reducing the PAH heating efficiency; (iii) the H2 excitation in the outflow is not due to UV-pumping, but it is thermal (see also Ceci et al. 2025), likely produced by shocks. A shock origin for the NIR H2 emission in NGC 6240 was pointed out by previous studies based on several lines of evidence, such as the high H2/Brγ ratios (3-48, Müller-Sánchez et al. 2018), the H2 morphology, and high-velocity H2 wings (Ohyama et al. 2000; van der Werf et al. 1993). van der Werf et al. (1993) proposed that the shocked H2 emission is due to the ISM collision in the merger, with a contribution from the outflow for the highest velocity H2 gas. As further argued in Sect. 4, based on our results, we strongly favour a scenario where most of the bright H2 emission in the nuclear region of NGC 6240 is due to cooling of shocked outflowing gas.
4. Discussion
4.1. Widespread outflows dominating the gas kinematics
Cicone et al. (2018) suggested that the molecular outflow originates from between the AGNs of NGC 6240, extending towards the eastern and western directions, and connecting with the larger-scale molecular outflowing material extending by up to 10 kpc across the source, especially in the eastern direction, as observed in CO(1-0), CO(2-1), and [CI](1-0) (Feruglio et al. 2013a; Cicone et al. 2018). In this work, we used JWST NIRSpec observations of the central region of NGC 6240 to understand to what extent the gas follows the stars in gravitational motions tied to the two progenitors’ stellar pseudo-bulges. We relied on a spectral line fitting decomposition (see Sect. 3.3) to identify gas components that are decoupled from the stellar kinematics and so involved in non-rotational motions that lack a stellar counterpart, such as outflows or inflows. This required assuming that a fraction of the emission from gas tracers arises from a component that follows the stellar kinematics. However, this assumption may not hold for all regions of the FoV, and so our estimates of the fraction of gas coupled with the stars should be considered as upper limits. Our results, despite being somewhat conservative as explained above, revealed that at least ∼65% (see Table 3) of NIR emission lines in the central 2 kpc of NGC 6240 trace gas components that are significantly decoupled from the stars. Such severe decoupling between gas and stars could already be inferred by the striking similarity between the total moment maps of gaseous tracers (Fig. 5) and the moment maps of the non-rotating components in the right panel of Fig. 6. In the latter, we identified two regions of enhanced velocity dispersion: (i) one around the N AGN, with an elongated structure extending along the minor axis of stellar rotation that is more pronounced in ionised gas tracers (Paα and [FeII]) than in the H2 1-0 S(1) line; (ii) an extended region of higher σv around and south of the S AGN, spreading across half of the FoV of the NIRSpec data. Our hypothesis is that the first feature (i) traces a bi-conical wind from the N AGN, and the second one (ii) traces a powerful and massive outflow, likely originating from the more luminous S AGN. This outflow coincides with that resolved in [CI](1-0) by Cicone et al. (2018) and in CO(2-1) by Treister et al. (2020). In the following, we discuss these two outflows separately.
4.1.1. A bi-conical AGN wind from the northern nucleus
The total velocity maps of gaseous tracers in Fig. 5 display a blue-shifted region east of the N AGN that is not consistent with the stellar kinematics, which is especially noticeable in ionised gas tracers, and marginally detected in the H2 lines. The corresponding 2nd moment maps show increased velocity dispersion at the same position. The bi-conical morphology of this feature and its alignment along the minor axis of stellar rotation become evident when isolating the non-rotating gas components in the right panels of Fig. 6. This bi-conical wind mainly involves ionised gas and extends up to r ∼ 500 pc on both sides of the nucleus. The co-spatiality with coronal line emission ([Si VI], [Si VII], [Mg VIII]) and the partial overlap with the AGN ionisation cone identified by Ceci et al. (2025), strongly point to a typical AGN wind. We refer to this as an AGN wind to distinguish it from the other outflow discussed in Sect. 4.1.2. Interestingly, the N AGN is, contrary from the southern one, significantly over-massive compared to the local MBH − σ* relation, by one order of magnitude (Medling et al. 2019).
Figure 7 shows that, in this region, there is no excess H2 emission with respect to PAH 3.3 μm. Therefore, either the H2 entrainment in the wind is low, or the wind hosts significant PAH 3.3 μm emission, for example thanks to its high UV irradiation. Both statements can be true, conspiring towards a low H2/PAH ratio in this northern AGN wind. To our knowledge, there have not been prior official reports of a molecular wind from the N AGN, but only of a ionised wind (Müller-Sánchez et al. 2018). However, the signature of such wind is marginally detected also in the H2 1-0 S(1) line. Furthermore, the highest resolution (0.03″ ∼ 15 pc) CO(2-1) velocity map available, obtained by Treister et al. (2020), shows a bi-conical structure of redshifted gas (v ∼ 300 − 400 km s−1), extending by r ∼ 500 − 750 pc on each side of the N AGN, and with an orientation consistent with that of the AGN wind discussed here. This feature is distinct from the highly red-shifted H2 gas ‘blob’ where the H2/PAH ratio peaks (see Sect. 3.7) and cannot be identified in the ALMA [CI](1-0) outflow maps from Cicone et al. (2018), probably due to angular resolution limitations. Hence, we conclude that some molecular gas is embedded in this northern wind, but its small spatial extent makes this component negligible compared to the bright H2 emission from the other regions of the FoV. Moreover, the coincidence with the AGN ionisation cone and its orientation hint at a bipolar wind expanding freely along the minor axis of rotation, hence probably not impacting nor shocking much of the surrounding ISM.
4.1.2. A powerful outflow from the southern nucleus
Spatially extended, non-rotating components decoupled from the stellar kinematics dominate the surface brightness of all NIR gas tracers investigated here (Fig. 6 and Table 3). In Paα and [FeII] emission, they are brightest around the S AGN, with a secondary peak near the N AGN, in correspondence of the AGN wind discussed previously. In the H2 1-0 S(1) line, non-rotating components are responsible for the characteristic concentration of H2 gas in the internuclear region, with a peak close to the S AGN. This central zone between the two AGNs: (i) is characterised by a significant H2/PAH enhancement (Fig. 7), which was linked to galactic outflows that embed shocked gas (Beirão et al. 2015), and (ii) overlaps with the region where the cold molecular outflow originates. Based on this evidence, in the following we propose an interpretation where most of the NIR H2 emission in this inter-nuclear region of NGC 6240 arises from the same massive molecular outflow extensively studied in FIR and (sub-)mm tracers (Feruglio et al. 2013a,b; Veilleux et al. 2013; Cicone et al. 2018; Saito et al. 2018; Treister et al. 2020).
To further explore the connection between cold and warm molecular gas components in this region, we show in the top panels of Fig. 8 the H2 1-0 S(1) channel maps, produced at redshifted velocities, with overlaid CO(1-0) contours probing the same velocity ranges. We remind that the emission from cold molecular gas tracers such as CO and [CI] at these velocities in NGC 6240 has been robustly ascribed to a massive molecular outflow (see Sect. 1). These maps demonstrate that there is a perfect spatial and kinematical correspondence between the warm and cold H2 gas emissions. The bottom left panel of Fig. 8 displays the velocity map of H2, with superimposed contours corresponding to the blue- and red-shifted wings of [CI](1-0) at v > 200 km s−1 (> 250 km s−1 for the redshifted gas) which trace the known outflow. There is a striking correspondence between the two tracers, despite the underlying H2 velocity map probes all of the H2-emitting gas reservoir (not just the non-rotating component) while the ALMA [CI] contours show only the high velocity outflow wings. This strengthens our hypothesis that the whole H2 NIR emission is dominated by the same outflow as seen in cold (sub-)mm tracers.
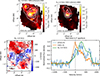 |
Fig. 8. Top left: H2 1-0 S(1) emission integrated within v ∈ [200, 500] km/s. Overlaid contours show the CO(1-0) outflow emission integrated within the same velocity range, corresponding to [60σ, 100σ, 140σ, 180σ] with 1σ = 0.05 Jy km s−1 beam−1. Top right: H2 1-0 S(1) emission integrated within v ∈ [500, 800] km/s. Overlaid contours show the CO(1-0) outflow emission within the same velocity range, corresponding to [6σ, 12σ, 18σ, 24σ] with 1 σ = 0.07 Jy km s−1 beam−1. Bottom left: Total H2 1-0 S(1) velocity map (i.e. same as shown in Fig. 5), with overlaid contours corresponding to the [CI](1-0) red- and blue-wing outflow emission. The crosses mark the AGN positions. Bottom right: Peak-normalised [CI](1-0), CO(1-0), and H2 1-0 S(1) spectra extracted from an aperture width diameter ∼0.2″ centred on the peak of highly redshifted molecular gas emission (‘red blob’) seen in the two maps in the top panels, at coordinates RA = 16:52:58.9219, Dec = 02:24:04.00355. |
Determining the origin of such massive molecular outflow has proven to be challenging. It may have been generated by the S AGN, given: (i) the detection of a separate (mostly ionised) wind from the N AGN (discussed in Section 4.1.1), (ii) the proximity with the S nucleus, and (iii) the overall disturbed kinematics and high-velocity values that affect gas in an extended area surrounding the S AGN. However, it remains difficult to explain why the brightest part of this outflow is observed about ∼1″ (500 pc in projected distance) north-east of the S AGN, where there is a highly redshifted (maximum velocity of 800 km s−1) blob of both cold and warm H2 emission, corresponding to the peak of H2/PAH ratio. The spectra of CO(1-0), [CI](1-0), and H2 1-0 S(1) extracted at the position of this red blob are shown in the bottom-right panel of Fig. 8, normalised by their respective peaks. All three spectra are very broad and encompass velocities from −250 km s−1 to 900 km s−1. The spectra of the cold gas tracers, i.e. CO(1-0) and [CI](1-0), display three peaks: at v ∼ 0 km s−1, v ∼ 300 km s−1, and v ∼ 700 km s−1, while the H2 line only shows two distinct peaks at v ∼ 300 km s−1, and v ∼ 700 km s−1. The latter may be a consequence of the lower spectral resolution of NIRSpec compared to ALMA. Nonetheless, the comparison between the three spectra shows clearly that the redshifted gas at v > 300 km s−1 contributes to most of the H2 total flux at this position, and it is also significantly bright in [CI](1-0).
Although the redshifted blob appears compact in size at the JWST angular resolution, it consists of multiple clumps, as it was spatially resolved by the high resolution ALMA CO observations presented by Treister et al. (2020). The spectra in Fig. 8 show that this blob is spectrally resolved into at least three spectral components. Moreover, Fig. 9, where the H2 emission is displayed as contours on top of the ALMA Band 7 continuum map, shows that there is no continuum point source associated with the redshifted blob. Therefore, it must be a gas-only feature: because of its spatial and spectral properties and, in particular, the high velocities involved, we hypothesise this blob to be connected to the southern outflow discussed here. The lack of overlap between the high-velocity H2 emission and the (brightest regions of the) (sub-)mm dust continuum in Fig. 9 is also consistent with theoretical predictions that galactic outflows propagate through paths of least resistance (e.g. Costa et al. 2015).
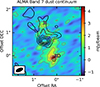 |
Fig. 9. ALMA Band 7 (870 μm) continuum map with overlaid redshifted H2 1-0 S(1) emission integrated within v ∈ [500, 800] km/s (same as the top-right map in Fig. 8). The grey contours showing the band 7 continuum correspond to [2σ, 5σ, 8σ, 11σ] with 1σ = 0.298 mJy/beam. The synthesised beam of the ALMA data is shown in the bottom left corner. The crosses indicate the AGN locations. |
In the 0th-moment map of the non-rotating H2 components (Fig. 6), we detected south of the S AGN two molecular filaments extending to the south-western and south-eastern directions. The strongest emission in the south-west coincides with the base of an Hα filament, suggested to be due to shock ionisation from stellar winds by Müller-Sánchez et al. (2018). These H2 filaments are characterised by a line-of-sight velocity close to zero or slightly redshifted in both H2 and [Fe II], while the Paα gas is blue-shifted at these positions. Between the two filamentary H2 structures, south of the S AGN, there is an extended zone of low H2/PAH ratio (≲0.2, see Fig. 7) that extends to the southern edge of the NIRSpec FoV. Ceci et al. (2025), based on the same NIRSpec data, identified here two separate features: a conical, blue-shifted (v ∼ −800 km/s) molecular outflow, extending south-east of the S AGN, and, a bit offset from it, an AGN ionisation cone extending southwards from the AGN. In our interpretation, what these authors isolate as a blue-shifted (single-cone) H2 outflow would be part of the larger-scale southern and central massive molecular outflow discussed in the previous paragraphs. Indeed, we do not find any indication supporting the hypothesis implicitly made by Ceci et al. (2025) that this southern blue-shifted component should be regarded as a separate outflow: in our analysis, as well as in the ALMA [CI](1-0) data (bottom-left panel of Fig. 8), this feature appears connected with the other high-velocity blue-shifted and redshifted molecular gas components extending also north of the S AGN.
4.2. About the H2 excitation: outflow vs. ISM collision?
The nature of the bright NIR H2 emission in NGC 6240 and its excitation mechanism have been extensively discussed in the literature, since the discovery that this source has a H2 1-0 S(1)-to-IR luminosity ratio that is one order of magnitude higher than the other (U)LIRGs from the sample of Goldader et al. (1995). Using H2 line ratios diagnostic diagrams, several works (e.g. van der Werf et al. 1993; Ohyama et al. 2000 and, most recently, Ceci et al. 2025) supported a thermal origin for the H2 excitation in NGC 6240, i.e. due to collisions of molecules maintaining the lowest rotational levels of H2 in thermal equilibrium. We independently confirmed their result, measuring the H2 2-1 S(1)/H2 1-0 (S1) line ratios for all spaxels of the JWST NIRSpec map and finding that they cluster around values of 0.1–0.15, as expected for thermal emission with rotational temperature around 2000 K.
There is instead less consensus about the mechanism responsible for the collisional excitation of the H2 gas. Several lines of evidence point to shocks as a main heating mechanism. First of all, the high H2/PAH ratio (see Sect. 3.7). Secondly, the fact that the whole ionised ISM of NGC 6240 shows shock-like excitation, in both NIR (Ceci et al. 2025) and optical diagnostic diagrams (Kollatschny et al. 2020). Thirdly, as pointed out by Meijerink et al. (2013), the highly excited CO ladder of NGC 6240 can only be explained by a global shock excitation of its molecular ISM. These authors argued that its exceptionally high CO line-to-continuum ratio rules out both PDRs and XDRs, as most of the absorbed UV or X-ray photons would heat the dust as well as the gas. In addition, the non detection of OH+ and H2O+ lines in the Herschel data shown by Meijerink et al. (2013) implies low ionisation fractions hence discarding cosmic rays or X-rays heating. We note that the shielding of most of the ISM gas from the AGN radiation despite the dual AGN nature of NGC 6240 may be explained by the Compton thick nature of both its AGNs (Fabbiano et al. 2020).
Once established that shocks are the culprit for the ISM excitation, including that of molecular gas, we need to understand what is the origin of the shocks. Due to its major merger nature, most of the discussion in the past has focused on large-scale shocks generated in the collision of the nuclear ISM of the two merging galaxies (van der Werf et al. 1993). Yet, already van der Werf et al. (1993) noted that the observed H2 velocities of ∼900 km s−1 are too high to be reconciled with this scenario, where the two nuclei are colliding at about 150 km s−1. Hence, they suggested that the high-v H2 is due to shocked gas entrained in the outflow, while the low-v H2 is due to merger-driven shocks. However, based on our analysis, we propose that most of the H2 1-0 S(1) emission in the nuclear region of NGC 6240, as much as 66 ± 2% of its total flux (Table 3), arises in a massive molecular outflow launched from the southern nucleus (see Sect. 4.1.2). Secondly, in Fig. 7 and Fig. 8, we showed that the H2/PAH peak and the most redshifted portion of the massive outflow, at velocities as high as v ∼ 900 km s−1, are coextensive. Furthermore, also in Fig. 8, we demonstrated that there is an almost perfect correlation between the global H2 dynamics, dominated by the brightest emission at lower projected velocities |v|< 200 km s−1, and the high velocity wings of [CI](1-0): this shows that there is no discontinuity between the lower- and the higher velocity components of H2, which we found to consistently trace the molecular outflow. For all these reasons, we favour a scenario where shock excitation in the molecular outflow is responsible for the global NIR H2 emission from NGC 6240. This supports the findings of Montoya Arroyave et al. (2024) that the global high CO excitation of local (U)LIRGs may be due to widespread massive molecular outflows.
5. Summary and conclusions
In this work, we used data from JWST/NIRSpec to study the kinematic properties of the gas in the central ∼2 kpc of the dual AGN NGC 6240. The main goal of our analysis was to study the outflows in this source. We devised a new spectral-line fitting approach to de-blend rotating and non-rotating gas components in the observed line emission, which is more physically motivated and better tailored to NGC 6240 than previous approaches. Our analysis also made use of archival ALMA observations of [CI](1-0), CO(1-0), and cold dust continuum emission. Our main findings were:
-
The NIR emission lines in NGC 6240 are dominated by gas components whose kinematics is considerably decoupled from that of the stellar component. These contribute to as much as 64% of the Paα and [FeII]1.644 μm fluxes, and to 66% of the H2 1-0 S(1) line flux. The rotational and ro-vibrational NIR H2 lines showed the most deviation from the stars, with peak emission between the two rotating stellar structures. The moment maps of the ionised gas tracers investigated in this work, i.e. the Paα, Paβ, and [FeII] lines at 1.257 and 1.644 μm, also showed considerable deviations from the stellar distribution. However, unlike the molecular lines, these tracers exhibited clear intensity peaks at the two AGN positions.
-
The PAH 3.3 μm feature and the cold dust emission at 870 μm peak at the two nuclei; hence, they present a very different morphology from the H2 gas. This supports the hypothesis that the bulk of H2 does not trace PDRs, because otherwise it should coincide with PAH emission due to the excitation of these molecules by UV photons.
-
The moment maps of the non-rotating components of the Paα and [Fe II] λ1.644 μm lines revealed a bi-conical wind in the northern nucleus, dominated by ionised gas. The wind was likely launched from the N AGN and it expands along the minor axis of stellar rotation. The western wind cone coincides with the AGN ionisation region identified by Ceci et al. (2025). Although such AGN wind entrains some H2 gas, it does not show a H2/PAH enhancement. Hence, such wind is either significantly UV-irradiated, which would enhance PAH 3.3 μm emission, or it entrains and shocks only a negligible amount of H2 gas compared to the global H2 content of the galaxy. The latter may result from an expansion of the wind along an ISM-free path.
-
In addition to the northern AGN wind, we proposed that most of the NIR H2 line emission from non-rotating components is involved in a massive outflow that extends across the bottom half of the NIRSpec FoV, possibly launched from the southern nucleus. This hypothesis is supported by the striking correlation between the warm H2 gas kinematics and that of the cold molecular outflow traced by [CI] and CO ALMA data. Therefore, this kpc-scale outflow is rich in both warm and cold H2 gas, and it is connected to the extended component of the cold molecular outflow detected out to 10 kpc in low-J CO and [CI](1-0) emission. Contrary to the northern AGN wind, this southern massive outflow, and in particular its receding side that reaches projected velocities as high as v ∼ 900 km s−1 in all molecular gas tracers, is spatially coincident with the region characterised by the strongest H2/PAH enhancement. This suggests that the shocks responsible for such high H2/PAH ratios are due to the outflow rather than to the ISM collision.
In conclusion, we showed that the majority of the NIR H2 emission from the central ∼2 kpc of NGC 6240 arises from T ∼ 2000 K shocked gas entrained in a massive molecular outflow, which is cooling down and coexisting with a colder phase probed by low-J CO and atomic carbon ([CI](1-0)) emission.
Acknowledgments
The authors thank the referee for their comments which have helped improve the manuscript. This paper makes use of the following ALMA data: ADS/JAO.ALMA#2013.1.00813.S, ADS/JAO.ALMA#2015.1.00717.S, and ADS/JAO.ALMA#2015.1.00003.S. ALMA is a partnership of ESO (representing its member states), NSF (USA), and NINS (Japan), together with NRC (Canada), MOST and ASIAA (Taiwan), and KASI (Republic of Korea), in cooperation with the Republic of Chile. The Joint ALMA Observatory is operated by ESO, AUI/NRAO, and NAOJ. CC thanks the ALMA European Regional Center for providing calibrated MS of the older ALMA datasets. This work is based in part on observations made with the NASA/ESA/CSA James Webb Space Telescope. The data were obtained from the Mikulski Archive for Space Telescopes at the Space Telescope Science Institute, which is operated by the Association of Universities for Research in Astronomy, Inc., under NASA contract NAS 5-03127 for JWST. These observations are associated with GTO program 1265. CC acknowledges funding from the European Union’s Horizon Europe research and innovation programme under grant agreement No. 101188037 (AtLAST2). Views and opinions expressed are however those of the author(s) only and do not necessarily reflect those of the European Union or European Research Executive Agency. Neither the European Union nor the European Research Executive Agency can be held responsible for them. CC, CV, PS acknowledge financial support from the INAF Bando Ricerca Fondamentale INAF 2022 Large Grant: “Dual and binary supermassive black holes in the multi-messenger era: from galaxy mergers to gravitational waves” and from the INAF Bando Ricerca Fondamentale INAF 2024 Large Grant: “The Quest for dual and binary massive black holes in the gravitational wave era”.
References
- Aalto, S., Garcia-Burillo, S., Muller, S., et al. 2012, A&A, 537, A44 [NASA ADS] [CrossRef] [EDP Sciences] [Google Scholar]
- Armus, L., Heckman, T. M., & Miley, G. K. 1990, ApJ, 364, 471 [Google Scholar]
- Begelman, M. C., Blandford, R. D., & Rees, M. J. 1980, Nature, 287, 307 [Google Scholar]
- Beirão, P., Armus, L., Lehnert, M. D., et al. 2015, MNRAS, 451, 2640 [CrossRef] [Google Scholar]
- Cappellari, M. 2017, MNRAS, 466, 798 [Google Scholar]
- Cappellari, M., & Emsellem, E. 2004, PASP, 116, 138 [Google Scholar]
- Ceci, M., Cresci, G., Arribas, S., et al. 2025, A&A, 695, A116 [NASA ADS] [CrossRef] [EDP Sciences] [Google Scholar]
- Cicone, C., Maiolino, R., Sturm, E., et al. 2014, A&A, 562, A21 [NASA ADS] [CrossRef] [EDP Sciences] [Google Scholar]
- Cicone, C., Severgnini, P., Papadopoulos, P. P., et al. 2018, ApJ, 863, 143 [NASA ADS] [CrossRef] [Google Scholar]
- Cicone, C., Maiolino, R., Aalto, S., Muller, S., & Feruglio, C. 2020, A&A, 633, A163 [NASA ADS] [CrossRef] [EDP Sciences] [Google Scholar]
- Colpi, M., Danzmann, K., Hewitson, M., et al. 2024, ArXiv e-prints [arXiv:2402.07571] [Google Scholar]
- Costa, T., Sijacki, D., & Haehnelt, M. G. 2015, MNRAS, 448, L30 [NASA ADS] [CrossRef] [Google Scholar]
- De Rosa, A., Vignali, C., Bogdanović, T., et al. 2019, New Astron. Rev., 86, 101525 [Google Scholar]
- Dotti, M., Colpi, M., Haardt, F., & Mayer, L. 2007, MNRAS, 379, 956 [NASA ADS] [CrossRef] [Google Scholar]
- Engel, H., Davies, R. I., Genzel, R., et al. 2010, A&A, 524, A56 [NASA ADS] [CrossRef] [EDP Sciences] [Google Scholar]
- EPTA Collaboration, InPTA Collaboration, Antoniadis, J., et al. 2023, A&A, 678, A50 [CrossRef] [EDP Sciences] [Google Scholar]
- Fabbiano, G., Paggi, A., Karovska, M., et al. 2020, ApJ, 902, 49 [NASA ADS] [CrossRef] [Google Scholar]
- Feruglio, C., Fiore, F., Maiolino, R., et al. 2013a, A&A, 549, A51 [NASA ADS] [CrossRef] [EDP Sciences] [Google Scholar]
- Feruglio, C., Fiore, F., Piconcelli, E., et al. 2013b, A&A, 558, A87 [NASA ADS] [CrossRef] [EDP Sciences] [Google Scholar]
- Fluetsch, A., Maiolino, R., Carniani, S., et al. 2021, MNRAS, 505, 5753 [NASA ADS] [CrossRef] [Google Scholar]
- Fosbury, R. A. E., & Wall, J. V. 1979, MNRAS, 189, 79 [Google Scholar]
- Fyhrie, A., Glenn, J., Rangwala, N., et al. 2021, ApJ, 922, 208 [NASA ADS] [CrossRef] [Google Scholar]
- Genzel, R., Lutz, D., Sturm, E., et al. 1998, ApJ, 498, 579 [Google Scholar]
- Gerssen, J., van der Marel, R. P., Axon, D., et al. 2004, AJ, 127, 75 [NASA ADS] [CrossRef] [Google Scholar]
- Goldader, J. D., Joseph, R. D., Doyon, R., & Sanders, D. B. 1995, ApJ, 444, 97 [NASA ADS] [CrossRef] [Google Scholar]
- Hagedorn, B., Cicone, C., Sarzi, M., Severgnini, P., & Vignali, C. 2026, A&A, 707, A77 [NASA ADS] [CrossRef] [EDP Sciences] [Google Scholar]
- Hagiwara, Y., Baan, W. A., & Klöckner, H.-R. 2011, AJ, 142, 17 [NASA ADS] [CrossRef] [Google Scholar]
- Heckman, T. M., Armus, L., & Miley, G. K. 1990, ApJS, 74, 833 [Google Scholar]
- Herbst, T. M., Graham, J. R., Beckwith, S., et al. 1990, AJ, 99, 1773 [Google Scholar]
- Hermosa Muñoz, L., Alonso-Herrero, A., Labiano, A., et al. 2025, A&A, 693, A321 [NASA ADS] [CrossRef] [EDP Sciences] [Google Scholar]
- Ilha, G. d. S., Bianchin, M., & Riffel, R. A. 2016, Ap&SS, 361, 178 [CrossRef] [Google Scholar]
- Iono, D., Wilson, C. D., Takakuwa, S., et al. 2007, ApJ, 659, 283 [NASA ADS] [CrossRef] [Google Scholar]
- Jakobsen, P., Ferruit, P., Alves de Oliveira, C., et al. 2022, A&A, 661, A80 [NASA ADS] [CrossRef] [EDP Sciences] [Google Scholar]
- Johnstone, M. A., Treister, E., Bauer, F. E., et al. 2025, ApJ, 995, 108 [Google Scholar]
- Kollatschny, W., Weilbacher, P. M., Ochmann, M. W., et al. 2020, A&A, 633, A79 [EDP Sciences] [Google Scholar]
- Komossa, S., Burwitz, V., Hasinger, G., et al. 2003, ApJ, 582, L15 [NASA ADS] [CrossRef] [Google Scholar]
- Krajnović, D., Cappellari, M., de Zeeuw, P. T., & Copin, Y. 2006, MNRAS, 366, 787 [Google Scholar]
- Lamperti, I., Pereira-Santaella, M., Perna, M., et al. 2022, A&A, 668, A45 [NASA ADS] [CrossRef] [EDP Sciences] [Google Scholar]
- Liu, D., Daddi, E., Schinnerer, E., et al. 2021, ApJ, 909, 56 [NASA ADS] [CrossRef] [Google Scholar]
- Lonsdale, C. J., Farrah, D., & Smith, H. E. 2006, in Astrophysics Update 2, ed. J. W. Mason, 285 [Google Scholar]
- Max, C. E., Canalizo, G., Macintosh, B. A., et al. 2005, ApJ, 621, 738 [NASA ADS] [CrossRef] [Google Scholar]
- Medling, A. M., Privon, G. C., Barcos-Muñoz, L., et al. 2019, ApJ, 885, L21 [CrossRef] [Google Scholar]
- Meijerink, R., Kristensen, L. E., Weiß, A., et al. 2013, ApJ, 762, L16 [Google Scholar]
- Merritt, D., & Milosavljević, M. 2005, Liv. Rev. Relat., 8, 8 [NASA ADS] [Google Scholar]
- Mihos, J. C., & Hernquist, L. 1996, ApJ, 464, 641 [Google Scholar]
- Montoya Arroyave, I., Cicone, C., Andreani, P., et al. 2024, A&A, 686, A47 [NASA ADS] [CrossRef] [EDP Sciences] [Google Scholar]
- Müller-Sánchez, F., Nevin, R., Comerford, J. M., et al. 2018, Nature, 556, 345 [Google Scholar]
- Nardini, E., Wang, J., Fabbiano, G., et al. 2013, ApJ, 765, 141 [Google Scholar]
- Newville, M., Otten, R., Nelson, A., et al. 2024, https://doi.org/10.5281/zenodo.12785036 [Google Scholar]
- Ohyama, Y., Yoshida, M., Takata, T., et al. 2000, PASJ, 52, 563 [NASA ADS] [Google Scholar]
- Ohyama, Y., Yoshida, M., & Takata, T. 2003, AJ, 126, 2291 [NASA ADS] [CrossRef] [Google Scholar]
- Pérez-Torres, M., Mattila, S., Alonso-Herrero, A., Aalto, S., & Efstathiou, A. 2021, A&ARv, 29, 2 [CrossRef] [Google Scholar]
- Perna, M., Arribas, S., Marshall, M., et al. 2023, A&A, 679, A89 [NASA ADS] [CrossRef] [EDP Sciences] [Google Scholar]
- Ricci, C., Privon, G. C., Pfeifle, R. W., et al. 2021, MNRAS, 506, 5935 [NASA ADS] [CrossRef] [Google Scholar]
- Rigopoulou, D., Donnan, F. R., García-Bernete, I., et al. 2024, MNRAS, 532, 1598 [NASA ADS] [CrossRef] [Google Scholar]
- Roueff, E., Abgrall, H., Czachorowski, P., et al. 2019, A&A, 630, A58 [NASA ADS] [CrossRef] [EDP Sciences] [Google Scholar]
- Rubinur, K., Das, M., & Kharb, P. 2019, MNRAS, 484, 4933 [Google Scholar]
- Saito, T., Iono, D., Ueda, J., et al. 2018, MNRAS, 475, L52 [NASA ADS] [CrossRef] [Google Scholar]
- Sanders, D. B., & Mirabel, I. F. 1996, ARA&A, 34, 749 [Google Scholar]
- Sanders, D. B., Soifer, B. T., Elias, J. H., et al. 1988, ApJ, 325, 74 [Google Scholar]
- Scoville, N., Sheth, K., Walter, F., et al. 2015, ApJ, 800, 70 [NASA ADS] [CrossRef] [Google Scholar]
- Spoon, H. W. W., Farrah, D., Lebouteiller, V., et al. 2013, ApJ, 775, 127 [Google Scholar]
- Sturm, E., González-Alfonso, E., Veilleux, S., et al. 2011, ApJ, 733, L16 [NASA ADS] [CrossRef] [Google Scholar]
- Tacconi, L. J., Genzel, R., Tecza, M., et al. 1999, ApJ, 524, 732 [CrossRef] [Google Scholar]
- Treister, E., Messias, H., Privon, G. C., et al. 2020, ApJ, 890, 149 [NASA ADS] [CrossRef] [Google Scholar]
- U, V. 2022, Universe, 8, 392 [Google Scholar]
- van der Werf, P. P., Genzel, R., Krabbe, A., et al. 1993, ApJ, 405, 522 [NASA ADS] [CrossRef] [Google Scholar]
- Van Wassenhove, S., Volonteri, M., Mayer, L., et al. 2012, ApJ, 748, L7 [Google Scholar]
- Vazdekis, A., Koleva, M., Ricciardelli, E., Röck, B., & Falcón-Barroso, J. 2016, MNRAS, 463, 3409 [Google Scholar]
- Veilleux, S., Shopbell, P. L., Rupke, D. S., Bland-Hawthorn, J., & Cecil, G. 2003, AJ, 126, 2185 [NASA ADS] [CrossRef] [Google Scholar]
- Veilleux, S., Rupke, D. S. N., Kim, D.-C., et al. 2009, ApJS, 182, 628 [Google Scholar]
- Veilleux, S., Meléndez, M., Sturm, E., et al. 2013, ApJ, 776, 27 [Google Scholar]
- Veilleux, S., Maiolino, R., Bolatto, A. D., & Aalto, S. 2020, A&ARv, 28, 2 [NASA ADS] [CrossRef] [Google Scholar]
- Yoshida, M., Yagi, M., Ohyama, Y., et al. 2016, ApJ, 820, 48 [Google Scholar]
Appendix A: Supplementary material
Identified emission lines.
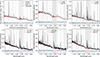 |
Fig. A.1. Data (black) and best-fit stellar continuum (red) obtained with pPXF in the 1.7 μm band, for spectra extracted from the individual spaxels marked in Fig. 3. The shaded grey regions were masked from the stellar fit. |
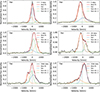 |
Fig. A.2. Paα line fit results, for the six spaxels marked in Fig. 3. The observed spectra are shown as solid black curves, and the overall best-fit models as solid red curves. The rotating component is indicated by a dashed blue curve, while the two non-rotating components are shown in dashed orange and green curves, respectively. The spectra were peak-normalised. |
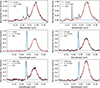 |
Fig. A.8. PAH 3.3 μm fit results for the six spaxels marked in Fig. 3. The blue curve is the fit to the H2 1−0O(5) emission line, which was detected in all spaxels. |
All Tables
Initial parameters and parameter bounds used for the three Gaussian functions during the spectral line fitting.
All Figures
|
Fig. 1. RGB composite map of NGC 6240 obtained with JWST NIRSpec, tracing the emission at ∼1.6 μm (blue), 2.9 μm (green), and 4.6 μm (red). Four representative apertures with 0.3″ radius are shown on the map: the VLBI positions (Hagiwara et al. 2011) of the two known AGNs (N and S) at RA = 16h52m58s.9241, Dec = 02° 24′04″.776, and RA = 16h52m58s.8902, Dec = 02° 24′03″.350 respectively; a central position between the nuclei (C), at RA = 16h52m58s.907, Dec = 02°24′4″.063, and an offset point to the east (OE), at RA = 16h52m58s.978, Dec = 02°24′3″.859. The physical scale of the map (500 pc) is indicated by the white line. |
| In the text | |
|
Fig. 2. Relative intensity of spectra extracted using an aperture of 3 spaxels from the northern (N) and southern (S) nuclei, a centre (C) point between the AGNs, an offset (OE) point (see Fig. 1), and the full FoV (Total). The spectra are joined from the three JWST/NIRSpec grating/filter compositions to cover all the wavelengths. CO bands are marked as shaded regions. Atomic lines are annotated in black, ro-vibrational H2 transitions in red, and pure rotational H2 transitions in blue. |
| In the text | |
|
Fig. 3. Analysis of the stellar dynamics, showing the presence of two rotating structures. The left and middle panels show respectively the stellar velocity and velocity dispersion maps obtained from the 1.0 μm and 1.7 μm bands using pPXF (we note that the colour bars have different limits). The points N, S, C, and OE indicated on the maps are the same as Fig. 1. The other two positions are centred at RA = 16h52m58s.829, Dec = 02°24′4″.369 (ONW) and RA = 16h52m58s.863, Dec = 02°24′2″.331 (OSW). Examples of pPXF spectral fits are presented in Fig. A.1. The right panel shows the major axis PA (dashed grey lines) for the two stellar structures derived using the kinemetry tool (Krajnović et al. 2006). The two AGNs, marked with crosses, are used as kinematic centres. The northern PA is 26.5 ± 3.2°, and the southern PA is 153.0 ± 0.5°. Angles are measured anti-clockwise from the north. |
| In the text | |
|
Fig. 4. Left panel: Intensity map of the PAH 3.3 μm band. The AGN positions are marked with crosses. Right panel: High resolution ALMA map of the 870 μm dust continuum, with overlaid PAH 3.3 μm contours. |
| In the text | |
|
Fig. 5. Moment maps for six selected emission lines: two hydrogen recombination lines Paα and Paβ, two strong molecular hydrogen lines H2 1-0 S(1) and H2 0-0 S(8), and two ionised iron lines [Fe II] λ1.644 μm and [Fe II] λ1.257 μm. The zeroth moment is shown in the upper panel, the first in the middle, and the second in the lower panel. The AGN positions are marked with crosses. |
| In the text | |
|
Fig. 6. Moment maps of rotating (left) and non-rotating (right) components of the Paα, H2 1-0 S(1), and [Fe II] λ1.644 μm emission lines. Only spaxels with S/N > 2 are plotted. The crosses indicate the AGN positions. |
| In the text | |
|
Fig. 7. Map of the intensity ratio between the rotational H2 0-0 S(8) line and the PAH 3.3 μm emission band. The contours in the right panel are the [CI](1-0) red- and blue-wing outflow emission from Cicone et al. (2018), corresponding to [3σ, 6σ, 15σ, 21σ] with σ = 1.1 mJy/beam for the red wing, and 1.0 mJy/beam for the blue wing. White crosses mark the AGN positions. |
| In the text | |
|
Fig. 8. Top left: H2 1-0 S(1) emission integrated within v ∈ [200, 500] km/s. Overlaid contours show the CO(1-0) outflow emission integrated within the same velocity range, corresponding to [60σ, 100σ, 140σ, 180σ] with 1σ = 0.05 Jy km s−1 beam−1. Top right: H2 1-0 S(1) emission integrated within v ∈ [500, 800] km/s. Overlaid contours show the CO(1-0) outflow emission within the same velocity range, corresponding to [6σ, 12σ, 18σ, 24σ] with 1 σ = 0.07 Jy km s−1 beam−1. Bottom left: Total H2 1-0 S(1) velocity map (i.e. same as shown in Fig. 5), with overlaid contours corresponding to the [CI](1-0) red- and blue-wing outflow emission. The crosses mark the AGN positions. Bottom right: Peak-normalised [CI](1-0), CO(1-0), and H2 1-0 S(1) spectra extracted from an aperture width diameter ∼0.2″ centred on the peak of highly redshifted molecular gas emission (‘red blob’) seen in the two maps in the top panels, at coordinates RA = 16:52:58.9219, Dec = 02:24:04.00355. |
| In the text | |
|
Fig. 9. ALMA Band 7 (870 μm) continuum map with overlaid redshifted H2 1-0 S(1) emission integrated within v ∈ [500, 800] km/s (same as the top-right map in Fig. 8). The grey contours showing the band 7 continuum correspond to [2σ, 5σ, 8σ, 11σ] with 1σ = 0.298 mJy/beam. The synthesised beam of the ALMA data is shown in the bottom left corner. The crosses indicate the AGN locations. |
| In the text | |
|
Fig. A.1. Data (black) and best-fit stellar continuum (red) obtained with pPXF in the 1.7 μm band, for spectra extracted from the individual spaxels marked in Fig. 3. The shaded grey regions were masked from the stellar fit. |
| In the text | |
|
Fig. A.2. Paα line fit results, for the six spaxels marked in Fig. 3. The observed spectra are shown as solid black curves, and the overall best-fit models as solid red curves. The rotating component is indicated by a dashed blue curve, while the two non-rotating components are shown in dashed orange and green curves, respectively. The spectra were peak-normalised. |
| In the text | |
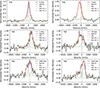 |
Fig. A.3. Same as Fig. A.2, but for the Paβ line. |
| In the text | |
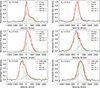 |
Fig. A.4. Same as Fig. A.2, but for the H2 1-0 S(1) line. |
| In the text | |
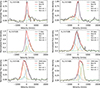 |
Fig. A.5. Same as Fig. A.2, but for the H2 0-0 S(8) line. |
| In the text | |
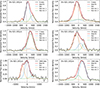 |
Fig. A.6. Same as Fig. A.2, but for the [Fe II] λ1275 line. |
| In the text | |
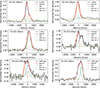 |
Fig. A.7. Same as Fig. A.2, but for the [Fe II] λ1644 line. |
| In the text | |
|
Fig. A.8. PAH 3.3 μm fit results for the six spaxels marked in Fig. 3. The blue curve is the fit to the H2 1−0O(5) emission line, which was detected in all spaxels. |
| In the text | |
Current usage metrics show cumulative count of Article Views (full-text article views including HTML views, PDF and ePub downloads, according to the available data) and Abstracts Views on Vision4Press platform.
Data correspond to usage on the plateform after 2015. The current usage metrics is available 48-96 hours after online publication and is updated daily on week days.
Initial download of the metrics may take a while.