Fig. 3.
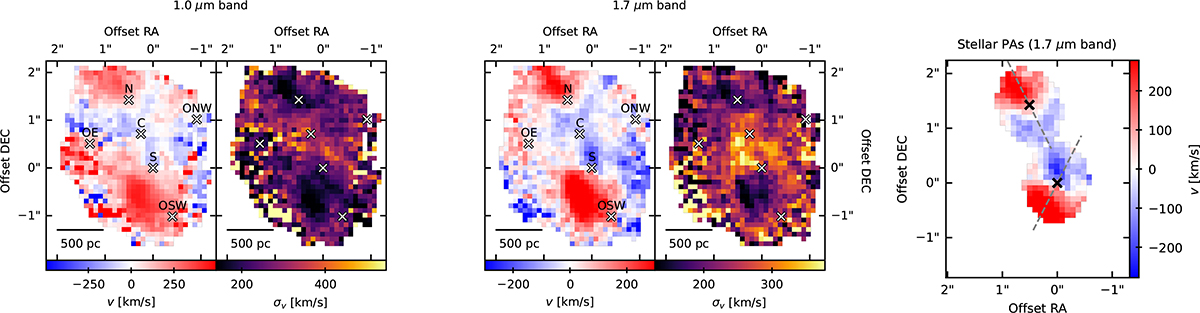
Download original image
Analysis of the stellar dynamics, showing the presence of two rotating structures. The left and middle panels show respectively the stellar velocity and velocity dispersion maps obtained from the 1.0 μm and 1.7 μm bands using pPXF (we note that the colour bars have different limits). The points N, S, C, and OE indicated on the maps are the same as Fig. 1. The other two positions are centred at RA = 16h52m58s.829, Dec = 02°24′4″.369 (ONW) and RA = 16h52m58s.863, Dec = 02°24′2″.331 (OSW). Examples of pPXF spectral fits are presented in Fig. A.1. The right panel shows the major axis PA (dashed grey lines) for the two stellar structures derived using the kinemetry tool (Krajnović et al. 2006). The two AGNs, marked with crosses, are used as kinematic centres. The northern PA is 26.5 ± 3.2°, and the southern PA is 153.0 ± 0.5°. Angles are measured anti-clockwise from the north.
Current usage metrics show cumulative count of Article Views (full-text article views including HTML views, PDF and ePub downloads, according to the available data) and Abstracts Views on Vision4Press platform.
Data correspond to usage on the plateform after 2015. The current usage metrics is available 48-96 hours after online publication and is updated daily on week days.
Initial download of the metrics may take a while.