Fig. 5.
Download original image
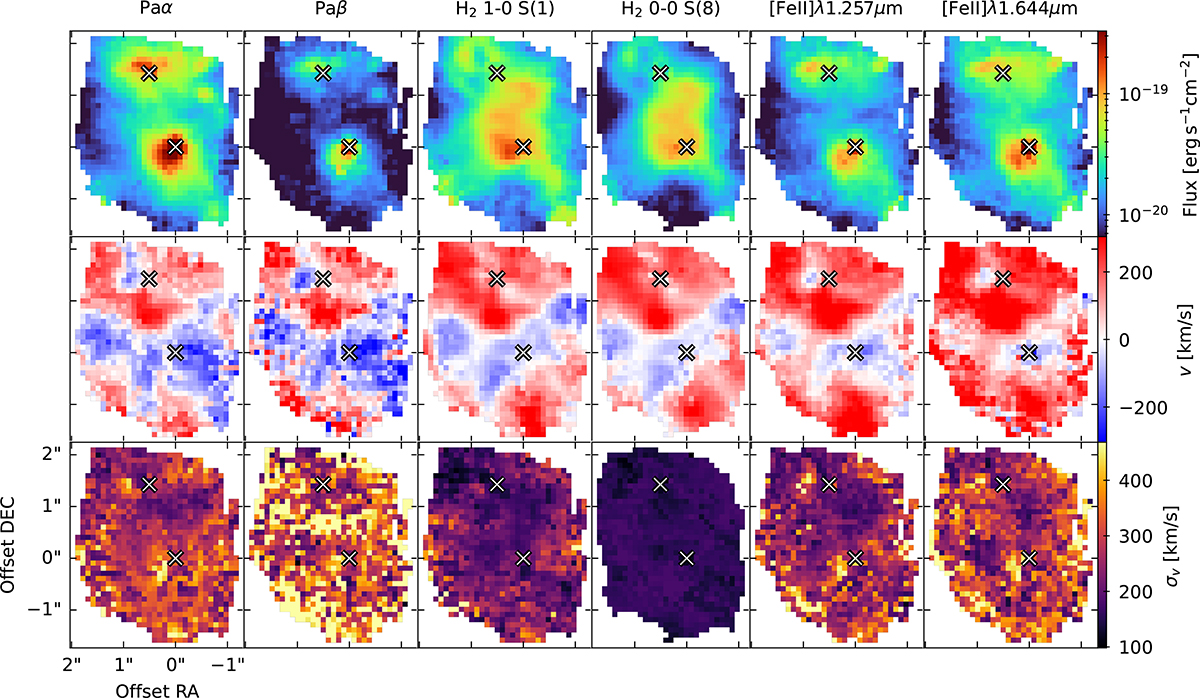
Moment maps for six selected emission lines: two hydrogen recombination lines Paα and Paβ, two strong molecular hydrogen lines H2 1-0 S(1) and H2 0-0 S(8), and two ionised iron lines [Fe II] λ1.644 μm and [Fe II] λ1.257 μm. The zeroth moment is shown in the upper panel, the first in the middle, and the second in the lower panel. The AGN positions are marked with crosses.
Current usage metrics show cumulative count of Article Views (full-text article views including HTML views, PDF and ePub downloads, according to the available data) and Abstracts Views on Vision4Press platform.
Data correspond to usage on the plateform after 2015. The current usage metrics is available 48-96 hours after online publication and is updated daily on week days.
Initial download of the metrics may take a while.