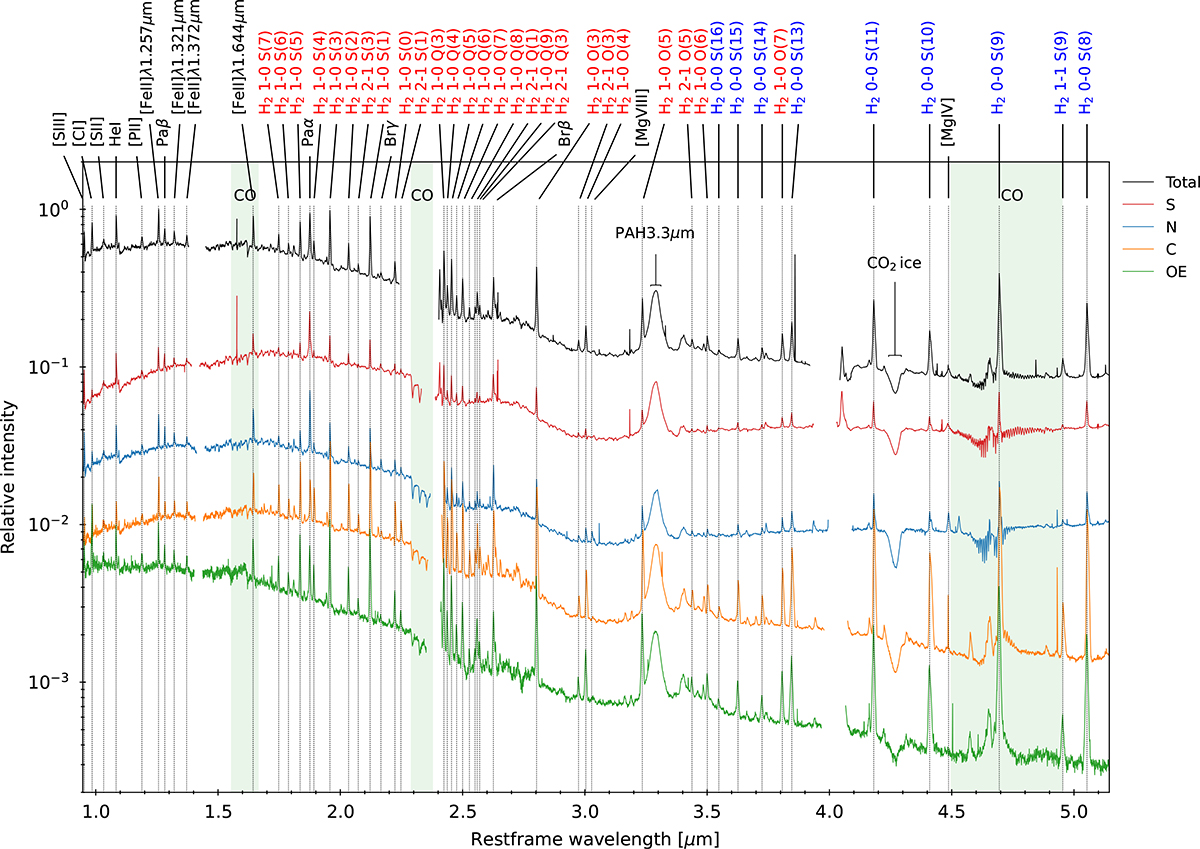
Fig. 2.
Download original image
Relative intensity of spectra extracted using an aperture of 3 spaxels from the northern (N) and southern (S) nuclei, a centre (C) point between the AGNs, an offset (OE) point (see Fig. 1), and the full FoV (Total). The spectra are joined from the three JWST/NIRSpec grating/filter compositions to cover all the wavelengths. CO bands are marked as shaded regions. Atomic lines are annotated in black, ro-vibrational H2 transitions in red, and pure rotational H2 transitions in blue.
Current usage metrics show cumulative count of Article Views (full-text article views including HTML views, PDF and ePub downloads, according to the available data) and Abstracts Views on Vision4Press platform.
Data correspond to usage on the plateform after 2015. The current usage metrics is available 48-96 hours after online publication and is updated daily on week days.
Initial download of the metrics may take a while.