Open Access
Fig. A.8.
Download original image
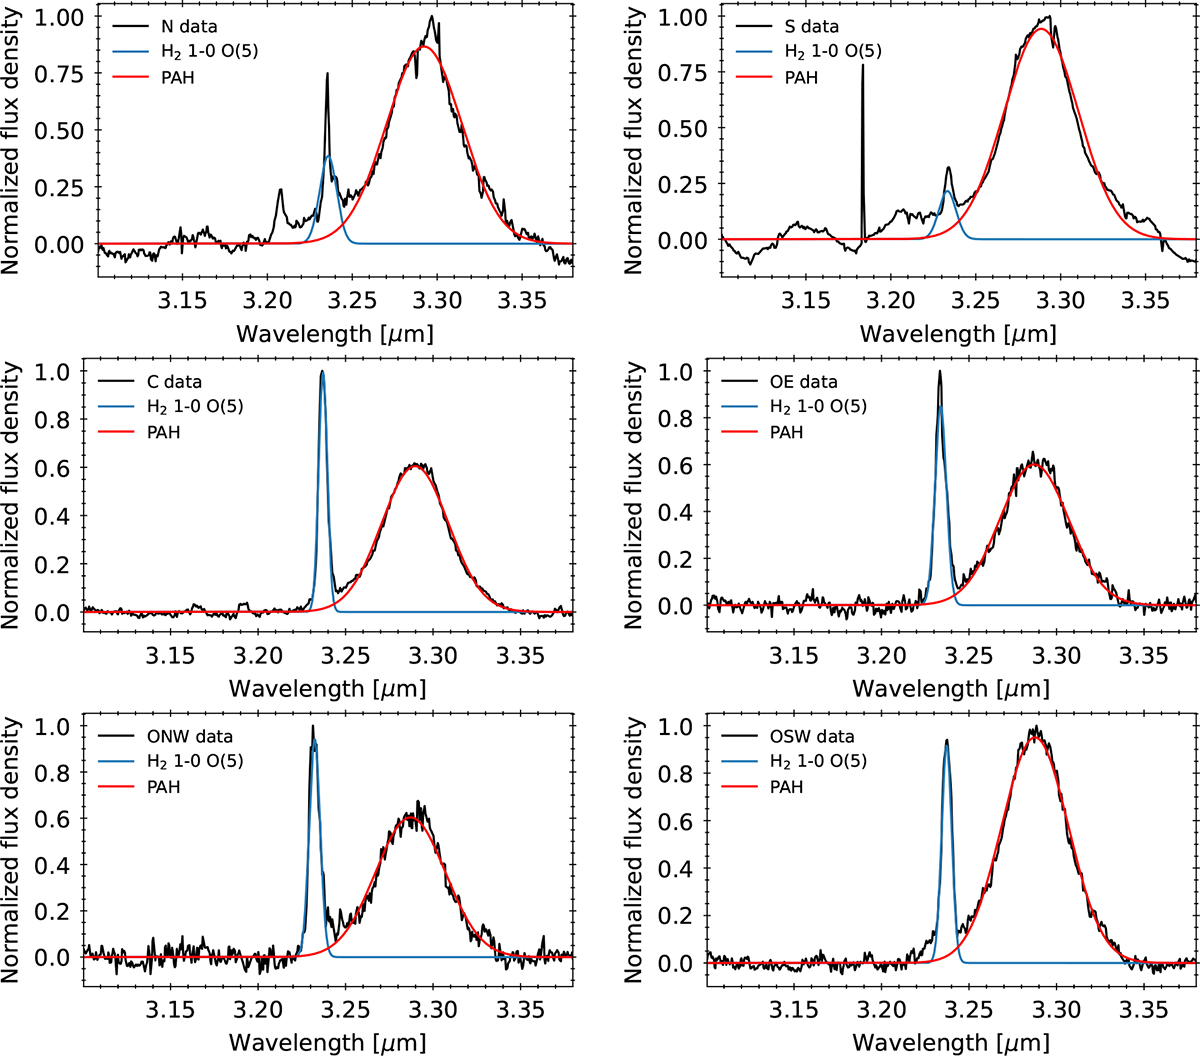
PAH 3.3 μm fit results for the six spaxels marked in Fig. 3. The blue curve is the fit to the H2 1−0O(5) emission line, which was detected in all spaxels.
Current usage metrics show cumulative count of Article Views (full-text article views including HTML views, PDF and ePub downloads, according to the available data) and Abstracts Views on Vision4Press platform.
Data correspond to usage on the plateform after 2015. The current usage metrics is available 48-96 hours after online publication and is updated daily on week days.
Initial download of the metrics may take a while.