Fig. 8.
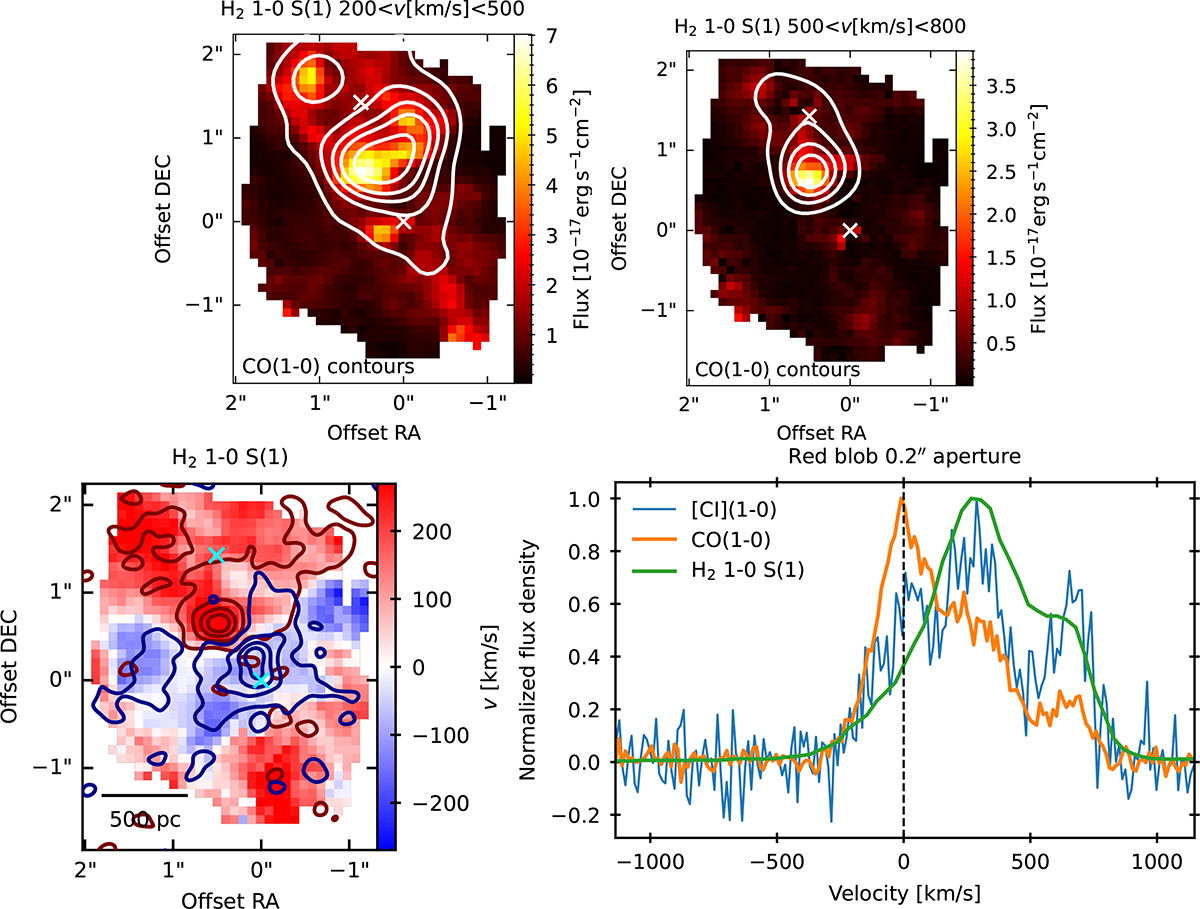
Download original image
Top left: H2 1-0 S(1) emission integrated within v ∈ [200, 500] km/s. Overlaid contours show the CO(1-0) outflow emission integrated within the same velocity range, corresponding to [60σ, 100σ, 140σ, 180σ] with 1σ = 0.05 Jy km s−1 beam−1. Top right: H2 1-0 S(1) emission integrated within v ∈ [500, 800] km/s. Overlaid contours show the CO(1-0) outflow emission within the same velocity range, corresponding to [6σ, 12σ, 18σ, 24σ] with 1 σ = 0.07 Jy km s−1 beam−1. Bottom left: Total H2 1-0 S(1) velocity map (i.e. same as shown in Fig. 5), with overlaid contours corresponding to the [CI](1-0) red- and blue-wing outflow emission. The crosses mark the AGN positions. Bottom right: Peak-normalised [CI](1-0), CO(1-0), and H2 1-0 S(1) spectra extracted from an aperture width diameter ∼0.2″ centred on the peak of highly redshifted molecular gas emission (‘red blob’) seen in the two maps in the top panels, at coordinates RA = 16:52:58.9219, Dec = 02:24:04.00355.
Current usage metrics show cumulative count of Article Views (full-text article views including HTML views, PDF and ePub downloads, according to the available data) and Abstracts Views on Vision4Press platform.
Data correspond to usage on the plateform after 2015. The current usage metrics is available 48-96 hours after online publication and is updated daily on week days.
Initial download of the metrics may take a while.