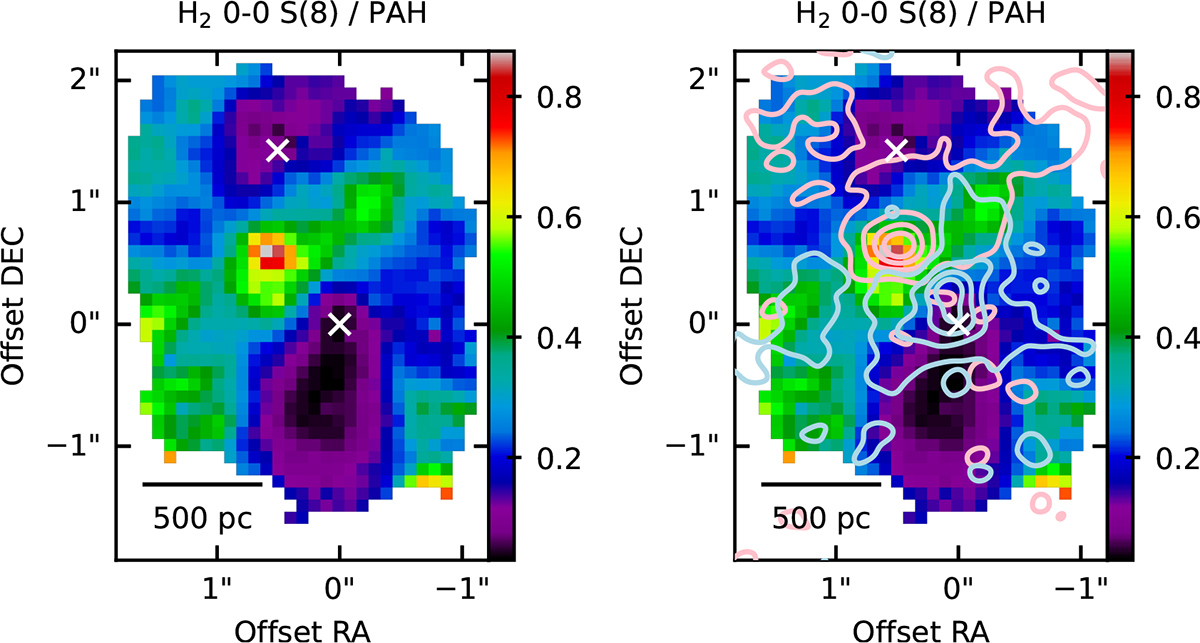
Fig. 7.
Download original image
Map of the intensity ratio between the rotational H2 0-0 S(8) line and the PAH 3.3 μm emission band. The contours in the right panel are the [CI](1-0) red- and blue-wing outflow emission from Cicone et al. (2018), corresponding to [3σ, 6σ, 15σ, 21σ] with σ = 1.1 mJy/beam for the red wing, and 1.0 mJy/beam for the blue wing. White crosses mark the AGN positions.
Current usage metrics show cumulative count of Article Views (full-text article views including HTML views, PDF and ePub downloads, according to the available data) and Abstracts Views on Vision4Press platform.
Data correspond to usage on the plateform after 2015. The current usage metrics is available 48-96 hours after online publication and is updated daily on week days.
Initial download of the metrics may take a while.