| Issue |
A&A
Volume 708, April 2026
|
|
|---|---|---|
| Article Number | A326 | |
| Number of page(s) | 15 | |
| Section | Extragalactic astronomy | |
| DOI | https://doi.org/10.1051/0004-6361/202558593 | |
| Published online | 21 April 2026 | |
Rapid jet ejection from PKS 0215+015 coincident with a high-energy neutrino event
1
Julius-Maximilians-Universität Würzburg, Institut für Theoretische Physik und Astrophysik, Lehrstuhl für Astronomie, Emil-Fischer-Straße 31, 97074 Würzburg, Germany
2
Max-Planck-Institut für Radioastronomie, Auf dem Hügel 69, 53121 Bonn, Germany
3
Joint Institute for VLBI ERIC, Oude Hoogeveensedijk 4, 7991 PD, Dwingeloo, The Netherlands
4
GFZ Helmholtz Centre for Geosciences, Telegrafenberg, 14476 Potsdam, Germany
5
CSIRO Space and Astronomy, ATNF, PO Box 76 Epping NSW, 1710, Australia
6
INAF Istituto di Radioastronomia, Via Gobetti 101, 40129 Bologna, Italy
7
McDonnell Center for Space Science, Washington University, One Brookings Drive, St. Louis, MO 63130, USA
8
Remeis Observatory and Erlangen Centre for Astroparticle Physics, Universtität Erlangen-Nürnberg, Sternwartstr. 7, 96049 Bamberg, Germany
9
Department of Astrophysics, Institute for Mathematics, Astrophysics and Particle Physics (IMAPP), Radboud University, PO Box 9010, 6500 GL, Nijmegen, The Netherlands
10
Korea Astronomy and Space Science Institute, 776 Daedeok-daero, Yuseong-gu, Daejeon 34055, Republic of Korea
11
NASA HQ, 300 E St SW, Washington, DC 20546-0002, USA
12
Finnish Centre for Astronomy with ESO, University of Turku, 20014 Turku, Finland
13
Aalto University Metsähovi Radio Observatory, Metsähovintie 114, 02540 Kylmälä, Finland
14
Deutsches Elektronen-Synchrotron DESY, Platanenallee 6, 15738 Zeuthen, Germany
★ Corresponding author: florian@eppel.space
Received:
16
December
2025
Accepted:
27
February
2026
Abstract
Aims. We present a new neutrino-blazar multiwavelength-flare coincidence, observed in the blazar PKS 0215+015 that showed a strong multiwavelength outburst in positional and temporal coincidence with the IceCube neutrino track alert IC220225A similar to the case of TXS 0506+056. We investigate the immediate response of the radio jet to the major flare and a possible neutrino association.
Methods. We performed target-of-opportunity observations of PKS 0215+015 with the Very Long Baseline Array (VLBA) at 15 GHz, 23 GHz, and 43 GHz in full polarization for six epochs with a monthly cadence following the neutrino event. We combined the VLBA observations with monitoring data from the Effelsberg 100-m telescope, the Australia Telescope Compact Array, and Fermi/LAT.
Results. Based on our kinematic analysis, we identified a new rapid jet component with an apparent speed of ∼60−80 c, which was ejected around the arrival time of IC220225A. The fast component ejection is traced by a characteristic signature in polarization that suggests a shock–shock interaction with a quasi-stationary feature. By combining the VLBA results with radio variability data, we estimated a bulk Lorentz factor of Γ = 105 ± 56, and a jet viewing angle of ϑ = (1.47 ± 0.31)°.
Conclusions. We note that the properties of the rapid component exceed previously reported maximum apparent jet speeds and Lorentz factors reported by continuous monitoring programs. This is likely only possible because we are observing an exceptional flaring event at high redshift (z = 1.72), with a higher observing cadence than in typical monitoring programs. We suggest that neutrino production in PKS 0215+015 can happen through pγ-interactions with protons possibly accelerated within the fast moving feature. The target photon field could be external to the jet or explained by a multi-layered jet. The latter scenario would be in agreement with the presence of quasi-stationary features revealed in our analysis.
Key words: neutrinos / radiation mechanisms: non-thermal / methods: observational / galaxies: active / galaxies: jets / quasars: individual: PKS 0215+015
© The Authors 2026
 Open Access article, published by EDP Sciences, under the terms of the Creative Commons Attribution License (https://creativecommons.org/licenses/by/4.0), which permits unrestricted use, distribution, and reproduction in any medium, provided the original work is properly cited.
This article is published in open access under the Subscribe to Open model.
Open access funding provided by Max Planck Society.
1. Introduction
Following the discovery of TXS 0506+056 as the first astrophysical high-energy neutrino-source in 2017 (IceCube Collaboration 2018b), the hunt for additional neutrino-emitting sources has been ongoing. Meanwhile, the IceCube Collaboration (2022) have identified the active galaxy NGC 1068 and the galactic plane (IceCube Collaboration 2023) as additional neutrino emitters. Moreover, several works suggest a statistical correlation between bright active galactic nuclei (AGNs), more specifically blazars, and high-energy neutrino events (e.g., Plavin et al. 2020, 2021, 2023; Hovatta et al. 2021; Buson et al. 2022; Kouch et al. 2024). While these statistical associations are still under debate (e.g., Bellenghi et al. 2023; Abbasi et al. 2023a), several individual blazars such as PKS 0735+178 (Kadler et al. 2021; Sahakyan et al. 2023; Acharyya et al. 2023; Kim et al. 2024; Paraschos et al. 2025), PKS 0446+11 (Eppel et al. 2024a; Kovalev et al. 2024, 2026) and PKS 1725+123 (Nanci et al. 2022) have raised the interest of the community, as they exhibited prominent flaring events close in time to IceCube neutrino events, similar to the case of TXS 0506+056 (see also Sumida et al. 2022; Jiang et al. 2024; Ji & Wang 2024; Kőmíves et al. 2024; Perger et al. 2025).
We present the case of PKS 0215+015, which was found to be in a strong multiwavelength outburst in coincidence with the IceCube neutrino event IC220225A (Eppel et al. 2023). On February 25, 2022, the IceCube Collaboration reported the discovery of the neutrino event IC220225A1, classified as a “bronze” type, with a “signalness” (i.e., probability for the neutrino to be of astrophysical origin) of 38% and an energy of ∼150 TeV. PKS 0215+015 exhibited a gamma-ray flux more than seven times greater than the average reported in the 4FGL-DR3 catalog on the day preceding the neutrino event (Garrappa et al. 2022). Additionally, the source showed strong optical (Nesci 2022) and radio flaring activity (Kadler et al. 2022; Plavin et al. 2022).
PKS 0215+015 was initially classified as a BL Lacertae (BL Lac) object by Gaskell (1982), and is located at a redshift of z = 1.72 (Blades et al. 1985; Foltz & Chaffee 1987). In contrast to its initial classification, the detection of spectral lines by Foltz & Chaffee (1987) suggests a flat-spectrum radio quasar (FSRQ) or changing-look AGN behavior. Moreover, Foschini et al. (2022) note that the BL Lac-type spectrum was observed during a faint state of the source, while the FSRQ spectrum was taken at a bright state, likely caused by a change of accretion rate. This could be relevant in context of neutrino production since FSRQs are considered to be likely sources of high-energy neutrinos, due to their high density of target photons for the pγ-channel (e.g., Atoyan & Dermer 2001; Murase et al. 2014; Moretti & Caccianiga 2025).
Triggered by the strong multiwavelength flare, coincident with IC220225A, we carried out a dense radio monitoring campaign of PKS 0215+015 with the Effelsberg 100 m-telescope, the Australia Telescope Compact Array (ATCA), and the Very Long Baseline Array (VLBA). Here, we present our results on the immediate response of the radio jet to the major multiwavelength outburst and possible neutrino association. Throughout the paper, we assume a flat cosmology with H0 = 67.4 km s−1 Mpc−1, and Ωm = 0.315 (Planck Collaboration VI 2020). This puts PKS 0215+015 at a luminosity distance of 13 Gpc, with a linear scale of 8.7 pc mas−1, such that an apparent motion with 1 mas yr−1 corresponds to a speed of 77 c.
2. Observations and analysis
2.1. Sources in the IC220225A field
In order to find astrophysical sources coincident with the uncertainty region of IC220225A, we crossmatched the neutrino region published by IceCube with the Fermi/LAT 4FGL-DR3 catalog (Abdollahi et al. 2022) as well as with the Radio Fundamental Catalog (RFC 2025a, Petrov & Kovalev 2025). IceCube provides different stages of their high-energy track alerts: first, a real-time localization published via AMON2 (Rev 0), followed by a refined localization (Rev 1), and usually a GCN circular3. While the AMON regions (Rev 1 and Rev 0) come with radial errors, the GCN circular contains asymmetric errors around a center position in right ascension and declination, usually resulting in a “box” shape. Based on what Abbasi et al. (2023b) reported, these “GCN-boxes” can often be approximated with ellipses. However, the exact shape of the uncertainty region within the GCN-box is not made publicly available immediately. In accordance with Abbasi et al. (2023b), we therefore consider the full GCN-box as the best and most conservative approximation of the real uncertainty region. As an overview, in Fig. 1, we show the latest AMON (Rev 1) 90% uncertainty region of IC220225A, the GCN-box, and the interpolated GCN ellipse region, based on the GCN-box. Within the GCN-box, there are 20 sources from the RFC, with PKS 0215+015 being the brightest one, based on the median X-band flux density listed in the RFC (∼0.8 Jy). Moreover, the region includes two sources from the 4FGL-DR3 catalog, 4FGL J0208.5−0046 and 4FGL J0217.8+0144. The latter is associated with PKS 0215+015, and due to its strong multiwavelength flare at the time of IC220225A, it stands out as an intriguing counterpart to the neutrino event.
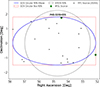 |
Fig. 1. Uncertainty regions of the neutrino IC220225A (90% confidence) as reported by the IceCube Collaboration via AMON (black dashed line) and GCN circular (blue ellipse and red dashed box). RFC sources within the GCN box region are displayed as black dots. Gamma-ray detected sources from the 4FGL catalog are highlighted as green stars. PKS 0215+015 stands out as the only gamma-ray detected source within all three regions. |
2.2. VLBA observations
Following the neutrino association in February 2022, we obtained target-of-opportunity (ToO) observations of PKS 0215+015 with the VLBA (project code: BE082). The observations were carried out at three different frequencies (15 GHz/Ku-band, 23 GHz/K-band, and 43 GHz/Q-band) and covered six epochs with a monthly cadence, starting on March 24, 2022. The data were calibrated using the rPICARD pipeline (Janssen et al. 2019), based on CASA (CASA Team 2022). Imaging and self-calibration were carried out using standard methods in DIFMAP (Shepherd 1997). Final Stokes I images were produced with an entropy-based cleaning method (Homan et al. 2024) using the final CLEAN windows obtained during self-calibration. In order to correct for polarization leakage (i.e., D-terms), we used the PolSolve self-calibration approach (Martí-Vidal et al. 2021). Cleaning in Stokes Q and U between PolSolve iterations was performed using the entropy-based cleaning approach by Homan et al. (2024), with the same CLEAN windows as used for Stokes I. The resulting DIFMAP .mod files were re-imported to CASA for every PolSolve iteration. We assumed the D-terms to have converged when their average variation between iterations was < 1%. The scripts for the polarization calibration are available on GitHub4.
After leakage calibration, we performed a correction for the absolute orientation of the electric vector positon angle χ (EVPA). As an EVPA calibrator, we used BL Lac (2200+420), which was included in the observations. Based on MOJAVE observations at 15 GHz5 (Lister et al. 2018), and BEAM-ME observations at 43 GHz6 (Weaver et al. 2022), the EVPA of BL Lac is well sampled and stable during the time of our observations. We interpolated the MOJAVE and BEAM-ME EVPAs for BL Lac in time, to get an EVPA value for every ToO observation, for 15 GHz and 43 GHz, respectively. EVPA values for 23 GHz were interpolated between the 15 GHz and 43 GHz values, assuming a quadratic dependence of the EVPA with wavelength, as expected from Faraday rotation. For every frequency and epoch, we calculated Δχ = χcal − χobs, the difference between the expected EVPA χcal and the measured EVPA χobs of BL Lac. We corrected the RL-phase difference (2 × Δχ) accordingly with the AIPS-based RLCOR task (Greisen 1990), using ParselTongue (Kettenis et al. 2006).
As the final calibration step, we performed an absolute flux density calibration of the VLBA data by using single-dish information from the TELAMON program (see Sect. 2.3). Since the source has a very compact structure, we assumed a compactness factor of one (i.e., VLBA flux density equals single-dish flux density). This is justified since MOJAVE estimates of the 15 GHz extended flux density for PKS 0215+015 are less than 1 mJy, based on a comparison between well-calibrated parsec-scale total flux density and UMRAO and OVRO values. The VLBA flux densities at 15 GHz, 23 GHz, and 43 GHz (integrated CLEAN model) were scaled by using interpolated TELAMON 20 mm, 14 mm, and 7 mm flux densities of PKS 0215+015, respectively. An overview of the resulting scaling factors is given in Table 1. On average, ∼30% of the flux density is missing at 15 GHz, ∼50% at 23 GHz, and ∼90% at 43 GHz. The difference in the scaling factors between epochs and frequencies likely comes from pointing errors in the VLBA observations, which can be more significant at higher frequencies, due to smaller telescope beams. Additionally, the self-calibration process applied to the VLBA data can amplify the effect of initially low antenna amplitudes. This was especially severe in the second epoch at 15 GHz, where several antennas had low amplitudes, resulting in a scaling factor of 1.61. Additionally, it has been discussed previously by Livingston et al. (2025) that the bandpass normalization used in the default rPICARD settings can result in lower amplitudes by ∼10%. Since TELAMON single-dish data are free of self-calibration errors and pointing offsets are corrected during calibration (see Sect. 2.3), their use as a reference for the absolute flux density calibration is justified. We assumed a final flux density error of 5%, which is similar to what is used in other programs (e.g., Lister & Homan 2005).
Scaling factors used to adjust the VLBA flux densities to single-dish measurements.
We modeled the source structure with circular Gauss components for every epoch and frequency using the modelfit task in DIFMAP. We used the VCAT package (Baczko et al. 2025) to determine errors for every modelfit component with a signal-to-noise (S/N) based method (Schinzel et al. 2012), and their brightness temperatures, following Kovalev et al. (2005) (see Table B.1).
2.3. TELAMON/Effelsberg
We started observing PKS 0215+015 with the Effelsberg 100-m telescope as part of the TELAMON program after its neutrino association. The TELAMON program is using the Effelsberg 100-m telescope to monitor the radio spectra of active galactic nuclei (AGN) under scrutiny in astroparticle physics, namely TeV blazars and candidate neutrino-associated AGN (Eppel et al. 2024b). The first observation took place on Feb. 27, 2022, only two days after the neutrino alert. The source was observed for a total of 28 epochs until June 7, 2024. We observed the source with the S20mm (i.e., 14−17 GHz), S14mm (i.e., 19−25 GHz) and S7mm (i.e., 36−44 GHz) receivers in secondary focus, using multiple sub-bands per receiver. Data calibration and sub-band averaging was performed following Eppel et al. (2024b). In addition to the total intensity data, we obtained linear polarized intensity data for 20 mm and 7 mm in 19 epochs. We followed the data processing and calibration for TELAMON polarization data described by Hessdoerfer et al. (2023). For sessions where not enough polarization calibrators were observed, an average Müller-matrix was used to correct the instrumental polarization.
2.4. ATCA
The ATCA has been monitoring PKS 0215+015 since 2004 at multiple frequencies from 2.1 GHz up to 50 GHz as part of the AGN and calibrator monitoring program (Stevens et al. 2012). The data were processed by a standard pipeline and are publicly available7. We collected all data from the 4 cm, 15 mm and 7 mm bands after carefully checking their quality based on the “defect” and “closure phase” parameters on the website. The ATCA light curve is shown together with the TELAMON data in Fig. 2.
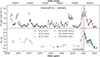 |
Fig. 2. Gamma-ray (upper panel) and radio (lower panel) light curves of PKS 0215+015. The source exhibited its historical high-state in both wavelengths coincident with the arrival time of IceCube neutrino event IC220224A (dashed red line). The new fast component 1 was ejected shortly before. Its possible ejection time range (1σ) is indicated by the gray shaded area. |
2.5. Fermi/LAT
Of the two gamma-ray sources in the GCN-box of IC220225A, only one, 4FGL J0217.8+0144 (PKS 0215+015) has publicly available data in the Fermi/LAT light curve repository8 (Abdollahi et al. 2023). We obtained its gamma-ray light curve in monthly binning, using a minimum detection significance of TS = 4 (corresponds to 2σ). The gamma-ray lightcurve is shown on top of the radio light curve in Fig. 2 and reveals its historical maximum directly after the neutrino event.
3. Results
3.1. Jet structure
PKS 0215+015 exhibits a very compact jet structure with a slightly extended jet to the East. We compiled stacked full polarization maps at 15 GHz, 23 GHz and 43 GHz from the six observing epochs in 2022 in Fig. 3. Before stacking, the individual images were centered on their core component, and convolved with the median beam for every frequency band (15 GHz: 1.32 × 0.54 mas, −8.3°; 23 GHz: 0.81 × 0.33 mas, −8.8°; 43 GHz: 0.49 × 0.19 mas, −11.2°). The increased resolution at 23 GHz and 43 GHz, as compared to 15 GHz, allows us to resolve a bit more of the faint extended jet structure. While earlier observations of this source (e.g., Lister et al. 2018) revealed extended structure up to ∼5 mas away from the core, the source structure was more compact in 2022, close in time to the neutrino event. We note that the brightness temperature of the core component reaches values of ∼1013 K around the peak of the flare (see Table B.1) and thus significantly exceeds the equipartition brightness temperature (Tb, eq = 5 × 10¹⁰ K, Readhead 1994).
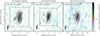 |
Fig. 3. Stacked polarization images at 15 GHz (left), 23 GHz (center), and 43 GHz (right). Before stacking, the individual images were convolved with the median beam (indicated by the gray ellipse) at each frequency separately. Contours show the total intensity, starting at four times the noise level and increasing by factors of two. The color map displays linear polarization, and the sticks indicate the direction of the EVPA. |
Following Pushkarev et al. (2009), we used all model components to calculate the apparent jet opening angle, ϕapp = (36 ± 18)°, averaged over all observing epochs and frequencies. Compared to a larger sample of Fermi-detected AGN (Pushkarev et al. 2017), this value is above the median of the population, but not unusually large. Moreover, we used the model components across all frequencies to fit a simple power law collimation profile (e.g., Kovalev et al. 2020), revealing a conical jet profile with power law index k = 1.17 ± 0.30 (see App. A).
3.2. Jet kinematics
We cross-identified the modelfit components across epochs and frequencies to determine the multi-frequency kinematics of the jet (for an overview about the cross-identifications see App. B). In total, we identified six distinct components, component 0 is the core component, and components 1−5 are identified as jet components. In Fig. 4, we show the kinematic plots (i.e., core distance vs. time) for components 1−4 at 15 GHz (left), 23 GHz (center), and 43 GHz (right). We note that the low-S/N component 5 is located ∼2−3 mas away from the core and does not imply significant motion, and is thus not considered in the kinematic analysis. For all other components, we fit their distance to the core vs. time linearly to determine an apparent component speed μapp, and ejection epoch t0 for moving components. The fit results for components 1−3 are shown in Table 2. Component 4 does not have enough detections to perform a sensible kinematic fit. In Fig. 4 one can clearly see that component 1 is moving away from the core at all three frequencies. The fit component speed μapp for component 1 varies slightly between the three frequencies but is consistent within the errorbars, suggesting fast motion of ∼0.8−1.0 mas/yr. Given the large redshift of PKS 0215+015, this translates to an apparent superluminal speed βapp of ∼60−80 c. The ejection times for component 1 suggest an ejection consistent with the arrival time of the neutrino, as indicated in Fig. 2. Components 2 and 3 show no significant motion, i.e., they are considered as stationary components (Jorstad et al. 2001b). Component 2 is only detected starting from the third epoch onward. This is likely the case since we cannot distinguish component 1 from component 2 in the first two epochs, since component 1 seems to move through stationary component 2. We decided to label this combined feature as component 1 to get the best constraints on the motion of component 1. Fitting component 1 only from epoch 3 onward results in comparable kinematics. Component 3 is located very close to the core (< 0.1 mas) and only detected at Q-band. It likely remains undetected at Ku- and K-band due to the limited resolution as compared to Q-band. As reported in Table 2, the speed of components 2 and 3 is consistent with zero.
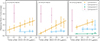 |
Fig. 4. Kinematic modeling of PKS 0215+015 at 15 GHz (left), 23 GHz (center), and 43 GHz (right). Component 1 is moving outwards, while components 2 and 3 are quasi-stationary. Fit parameters for all components at all frequencies are shown in Table 2. |
3.3. Radio variability properties
We analyzed the flares in the radio light curve to estimate a variability time scale and associated variability Doppler factor of PKS 0215+015, at the time of the neutrino event. We performed this analysis on the combined TELAMON and ATCA data, at three different frequency bands. We used TELAMON 20 mm data (15 GHz, Ku-band), combined TELAMON 14 mm and ATCA 15 mm (20 GHz, K-band), and combined TELAMON and ATCA 7 mm data (40 GHz, Q-band). The combined light curves are shown in Fig. 5 (top panel). We restricted the analysis to the period after the neutrino detection, since the rise of the first flare is not well enough sampled to perform a sensible fit. For every frequency, we fit two flares with exponential peaks of the form
 (1)
(1)
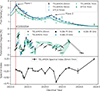 |
Fig. 5. Top: combined ATCA and TELAMON light curve with flare fits. Center: TELAMON fractional polarization at 20 mm and 7 mm. The inclined lines indicate the direction of the EVPA; errors are indicated by the shaded regions in EVPA and polarization. In addition to the TELAMON polarization values, we display the fractional polarization and EVPA of the VLBA data, for better visibility without uncertainties. Bottom: spectral index evolution obtained from TELAMON observations between 20 mm and 7 mm. The dashed red line indicates the time of IC220225A. |
following the approach by Lähteenmäki & Valtaoja (1999), where ΔSmax is the amplitude of the flare, τ the flare timescale, and tmax the time of the flare peak. After performing an initial CLEAN-like approach of fitting the two flares individually, we performed a common fit of both flares, using the previous fit values as starting values for the fit, and adding a fit parameter S0 for the flux density baseline. The best-fit parameters are shown in Table 3. From the obtained fit parameters, we estimated the variability brightness temperature (in the source frame),
 (2)
(2)
where DL is the luminosity distance in Mpc, ν the observing frequency in GHz, and z the redshift (Hovatta et al. 2009; Liodakis et al. 2017). Using Tb, var and assuming an equipartition brightness temperature Tb, eq = 5 × 10¹⁰ K (Readhead 1994; Lahteenmaki et al. 1999), we calculated the variability Doppler factor
 (3)
(3)
following Hovatta et al. (2009), Liodakis et al. (2017). The obtained Tb, var and δvar values for every flare and frequency are presented in Table 3. For the first flare, whose peak times match the neutrino arrival time, we obtain Doppler factors between δvar = 11.41 ± 0.53 at the highest frequencies (40 GHz) up to δvar = 25.85 ± 0.37 at 15 GHz. The second flare, peaking in early 2023, exhibits slightly lower δvar values from δvar = 9.2 ± 1.1 at 40 GHz up to δvar = 18.2 ± 0.76 at 15 GHz. The difference between the δvar values across the different frequencies is likely due to the fact that we are undersampling the variability at the higher frequencies and probably missing the peak flux densities in our monitoring data. This could also affect the lower frequency δvar estimate, especially for flare 1, since we do not have any coverage of the source between late 2021 and February 2022, where the flux density peak likely occurred. This means that the obtained δvar values for flare 1, especially at the higher frequencies, are probably slightly underestimated and might be closer to the value obtained for 15 GHz. On the other hand, the intrinsic brightness temperature used in Eq. (3) can exceed the equipartition value and reach values of several times 1011 K during flares (e.g., Homan et al. 2006). In such a scenario, the variability Doppler factors presented above could be systematically overestimated by a factor of 1.5−2 (see Sect. 3.5 for further discussion).
In addition to the flux density variability, we analyzed the variability of the radio spectral index in PKS 0215+015. For the spectral index analysis, we used all TELAMON epochs where data across at least 19.5 GHz up to 37 GHz were available and fit a power law of the form
 (4)
(4)
where α is the spectral index, to the data, as described by Eppel et al. (2024b). The spectral index evolution is plotted in Fig. 5 (bottom panel). We find a median spectral index of α = −0.24. Immediately after the neutrino event, PKS 0215+015 exhibits a rather flat spectrum in agreement with the median value. Shortly after the peak of the flare, the spectrum steepens during the decay of the radio flare and then becomes flat again. This behavior is consistent with the fast component 1 moving through the jet, as described in Sec. 3.2. The steeper spectral index suggests that optically thin emission dominates the jet, which is expected from an extended feature that is moving through the jet. Shortly after (∼2022.5) the source shows a flat spectrum again, consistent with the median spectral index which could indicate that the optically thick core component dominates the emission again (after ∼2022.5). After the second flare, we observed a similar spectral steepening; however, this part of the light curve is not as well sampled as the first flare, and no dense very-long-baseline interferometry (VLBI) data are available to probe for fast features associated with the spectral steepening.
3.4. Polarization properties
Based on the VLBA and TELAMON data, we analyzed the radio polarization properties of PKS 0215+015. In Fig. 5 (center panel), we show the evolution of the fractional polarization with time, the position angles of the EVPA are indicated by the tilted lines plotted on top of the data points. Fig. 5 displays both the TELAMON and VLBA polarization information that have completely independent calibration procedures, but show consistent results. The source shows strong variability in fractional polarization. Shortly after the neutrino event, we observed a flare of fractional polarization, reaching values close to ∼6%, followed by a sudden drop of fractional polarization down to values ≲1%, and an associated change in the EVPA direction. At the same time (i.e., ∼2022.3) the source is still in an elevated state in total intensity. After the fractional polarization dip, the source remains in the range of 1−4% fractional polarization which is similar to previous activity, based on archival MOJAVE observations. In Fig. 6, we display all full polarization images from the VLBA ToO campaign at all frequencies. The images reveal that the polarization originates almost entirely from the region close to the core throughout the observing campaign. The strong polarization flare and dip in the second epoch is clearly visible in the images. Some epochs show hints of extended polarized emission with perpendicular EVPA as compared to the core, which becomes better visible in the stacked maps in Fig. 3. The EVPA swing observed at the time of the polarization dip (consistent with VLBA epoch 2) is clearly visible in the VLBI images in Fig. 6. As discussed in Sect. 2.2, this epoch was affected by low amplitudes at several stations. However, we have carefully checked the cross-hand signals to confirm that the low polarization is not due to instrumental reasons.
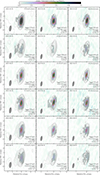 |
Fig. 6. Full polarization VLBI images of PKS 0215+015 from the conducted ToO campaign, convolved with the median beam for each frequency. The color map indicates linear polarized intensity. Contours correspond to total intensity and start at five times the noise level, increasing by factors of two. The direction of the EVPA is indicated by the tilted lines. |
We have estimated the Faraday rotation measure, RM = (χobs − χ0)/λ2, where χobs is the observed EVPA, χ0 the intrinsic EVPA, and λ the observing wavelength. The median RM across all TELAMON epochs where 20 mm and 7 mm polarization data was available is 117 rad/m2. From the VLBI observations, we obtain a median RM value of −154 rad/m2, after fitting the RM across all three VLBI frequencies for every epoch. Typical uncertainties for the RM per epoch are on the order of 200−300 rad/m2 for TELAMON, and ∼500 rad/m2 for the VLBA data, i.e., both datasets suggest an RM consistent with zero. A clear outlier is seen in the second VLBI epoch, at the time of the polarization dip, where the fit VLBI rotation measure is −(3000 ± 500) rad/m2.
3.5. Doppler factor, Lorentz factor, and viewing angle
With knowledge of the apparent jet speed, βapp, and the Doppler factor, δ, one can estimate the bulk Lorentz factor,
 (5)
(5)
and the jet viewing angle,
 (6)
(6)
following Lähteenmäki & Valtaoja (1999). As the apparent speed βapp, we consider the speed of the fast component 1 for every frequency individually, as determined by our kinematic analysis (see Table 2). For the Doppler factor, we use the variability Doppler factors of flare 1 as reported in Table 3, since it is likely associated with the jet ejection. We calculated the Lorentz factor and viewing angle for all frequencies independently. The Lorentz factor obtained at 15 GHz is ΓKu = 78 ± 67, consistent with the 23 GHz value ΓK = 160 ± 100, while at 43 GHz, the Lorentz factor cannot be constrained in a sensible way due to the large uncertainty of βapp in that band (formally ΓQ = 140 ± 180). Apart from βapp, the main source of error here is the uncertainty of the Doppler factor used in Eq. (5). As discussed in Sect. 3.3, δvar can be (i) underestimated due to an undersampled light curve and (ii) overestimated due to an elevated intrinsic brightness temperature during the flare that exceeds the equipartition value. Independent of the variability properties, the Doppler factor can also be estimated from the VLBI core brightness temperature, Tb, core, as δVLBI = Tb, core/Tb, int (Lahteenmaki et al. 1999). Indeed, making the same assumption as in Sect. 3.3, i.e., Tb, int = Tb, eq, and using the core Tb values from Table B.1 results in significantly higher Doppler factors than obtained from the variability, i.e., δVLBI ∼ 𝒪(102). This suggests that Tb, int likely exceeds the equipartition value, at least during some parts of the flare. Thus, the variability Doppler factors presented above would be overestimated. However, if δ ≲ 10, the resulting Lorentz factor would become unrealistically high, i.e., Γ ≳ 200. Therefore, we likely observe a combination of both effects, (i) and (ii), such that the δvar values presented in Sect. 3.3 are still reasonable estimates. As a more conservative approach we have estimated a lower limit for Γ by assuming the critical Doppler factor,  , i.e., the analytical minimum of Eq. (5). Following this approach, it becomes clear that the Lorentz factor related to apparent speeds of 60−80 c must be at least Γ > 60 − 80, regardless of the assumed Doppler factor. For the following discussion, we adapt the weighted mean value between 15 GHz and 23 GHz, Γ = 105 ± 56, calculated with the δvar values, consistent with the lower limit value. The viewing angle between all frequency bands is consistent within its error, i.e., ϑKu = (1.65 ± 0.57)°, ϑK = (1.34 ± 0.38)°, and ϑQ = (2.0 ± 1.3)°. This suggests a very small jet inclination angle, with a weighted mean of ϑ = (1.47 ± 0.31)° from all frequencies combined.
We note that already in previous studies, at times when PKS 0215+015 did not show such exceptional flaring activity, Lister et al. (2019) have reported superluminal jet speeds of βapp = (25.3 ± 1.2) c for this source. Based on these findings, Sebastian et al. (2022) have estimated a Lorentz factor of Γ = 37.4, and a viewing angle of θ = 0.6°. A slight change of the viewing angle and an acceleration of the jet seems possible, given the major flaring event immediately before our observations.
4. Discussion
4.1. Fast component ejection and shock–shock interaction
We interpret the fast ejection of component 1, revealed in the kinematic analysis (see Sect. 3.2), as a new jet feature, i.e., a traveling shock wave, that was born in response to the major flare observed in PKS 0215+015 in early 2022. The ejection of new jet features in response to major flares in AGN is well known (e.g., Jorstad et al. 2001a; Savolainen et al. 2002), and their interpretation as traveling shock waves is in line with the shocked jet model (Marscher & Gear 1985). The new feature appears to be very fast, with an apparent speed of βapp ∼ 60 − 80 c, and resulting bulk Lorentz factor Γ = 105 ± 56. We note that both of these values exceed the maximum apparent speeds (βapp ≲ 50 c) and Lorentz factors (Γ ≲ 50) reported for sources in the MOJAVE and VLBA-BU-BLAZAR AGN monitoring programs (Lister et al. 2021; Homan et al. 2021; Weaver et al. 2022). Several other works, however, suggest Lorentz factors Γ > 60 in exceptional cases (e.g., Fujisawa et al. 1999; Hovatta et al. 2009).
The case of PKS 0215+015 is likely such an exceptional event, where we observe a source at high redshift (z = 1.72), immediately after the peak of a major outburst. The MOJAVE program observes their sample sources with a cadence of several months or longer, which makes it difficult to detect features with βapp ≳ 50 c reliably, especially at lower redshifts. Revealing such (possibly short-lived) fast components is only possible with high-cadence (i.e., ≲ monthly) monitoring, and in response to major flaring events when new ejections are expected.
Due to its proximity to the core component, the uncertainty of the speed of component 1 is relatively large, when using the three observing frequencies separately as presented in Sect. 3.2. Under the assumption of a negligible core shift (see App. A), it is possible to use the component positions across frequencies for a combined kinematic fit, which yields slightly lower uncertainties. This is shown in Fig. 7, where we have performed a frequency-combined fit for jet components 1−3. While component 2 and 3 do not exhibit significant motion, the combined fit for component 1 suggests a speed of μapp = (80 ± 15) c, with an ejection epoch of 2022.10 ± 0.05, consistent with the results reported in Sect. 3.2. The simultaneous presence of stationary features suggests that this fast motion is not related to a change in synchrotron opacity (e.g., Plavin et al. 2019; Chamani et al. 2023) but represents the actual motion of the jet plasma. As shown in Fig. 7, the ejection of component 1 happened simultaneous to, or shortly before the arrival of the neutrino event IC220225A (see Fig. 2). Shortly after its ejection, the fast component 1 passes through the stationary components 3 and 2, likely resulting in shock–shock interactions.
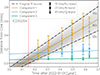 |
Fig. 7. Combined kinematic fit from 15 GHz, 23 GHz, and 43 GHz for component 1, 2, and 3. The solid line indicates the best fit. For component 1, the dash-dotted lines represent the 1σ fit bounds, and the shaded area in the background reflects the confidence range of the fit. The time of arrival of the neutrino event IC220225A is indicated by the dashed red line and coincides with the passage of component 1 through component 3. |
An additional trace of the fast motion of component 1 through the jet, and the shock–shock interactions, can be seen in the observed polarization light curve (see Fig. 5, center panel). If we assume that the component was ejected from the core around the time of the neutrino event, a sudden rise in fractional polarization is expected, due to the resulting opacity changes (e.g., Lara et al. 2001). Usually, the core component is expected to show relatively low fractional polarization due to synchrotron self-absorption (e.g., Pollack et al. 2003). Therefore, it is not surprising that at the peak of the total intensity flare, the fractional polarization is still in a relatively low state of ∼2%. As the new component is ejected from the core, the emission becomes more optically thin, and therefore a rise in fractional polarization is observed. Alternatively, the initial low-state in fractional polarization could already be the state of the first shock–shock interaction between component 1 and 3. The subsequent dip of fractional polarization is likely explained by a shock–shock interaction (e.g., Fromm et al. 2013) of the fast component 1 with the stationary component 2, located between 0.1−0.2 mas away from the core. This interaction is in agreement with the observed VLBI component propagation (see Fig. 4). If we assume that component 2 exhibits a different EVPA than component 1, the induced shock–shock interaction causes a net depolarization, which is observed in ∼2022.3 − 2022.4. This scenario is supported by the fact that in the stacked VLBI maps, we do see hints of a second polarized component with perpendicular EVPA to the core, especially in the stacked 15 GHz map in Fig. 3 (left). A shock–shock interaction can also explain the change in net EVPA direction (e.g., Liodakis et al. 2020; Paraschos 2025), observed around the time of the polarization dip, suggesting that component 2 slightly outshines component 1 and the core at that time. The net EVPA rotation could in principle also be caused by an external Faraday screen. However, since the RM in PKS 0215+015 for almost all epochs is close to zero, this is an unlikely scenario. The large outlier RM value observed at the time of the suggested shock–shock interaction in the second VLBI epoch is likely caused by the fact that we are observing different stages of the interaction at the different frequencies, due to synchrotron opacity. While at Q-band, the polarization is likely already dominated by the stationary feature, at 15 GHz, there is still a significant contribution from the core to the net EVPA visible, which causes an apparently large RM.
As component 1 moves away from component 2, its flux density decays and the core component dominates the emission again with typical fractional polarization values of ∼1−4%. As described in Sect. 3.3, the spectral index behavior is in agreement with the fast component ejection, showing a steepening of the spectrum as the component moves downstream, and then returning to a flat spectrum (after ∼2022.5), when the core emission dominates again. After flare 2 (see Fig. 5), a similar behavior in polarization and spectral steepening is observed; however, no simultaneous, dense VLBI data are available at that time to probe for a second fast component ejection possibly related to the second flare. Another possible explanation of the second flare could be a shock–shock interaction between the fast feature and another standing shock further downstream, possibly component 4.
4.2. Possibilities for neutrino production
Neutrinos in relativistic jets can be produced through hadronic (pp) or photopion (pγ) interactions (e.g., Mannheim 1993, 1995; Atoyan & Dermer 2001), with the latter being thought to be the dominant process (e.g., Oikonomou 2022). Most theoretical models assume a spherical emitting region (blob) with bulk Lorentz factor Γblob, where protons are accelerated. The protons interact with a target photon field, resulting in the production of high-energy neutrinos through the pγ-channel if protons of sufficiently high energy are present. The target photon field can be internal to the jet (usually assumed for BL Lac objects) or external to the jet (possible for FSRQs, e.g., photons from the accretion disk or broad line region, Oikonomou et al. 2019). In the case of PKS 0215+015, our results suggest that the fast blob where proton acceleration happens could be consistent with the newly ejected component 1 with bulk Lorentz factor Γ = 105 ± 56, but even the mildly relativistic quasi-stationary shocks close to the core are capable of accelerating protons to the required energies for neutrino production (e.g., Plavin et al. 2021; Kalashev et al. 2023). Additional evidence of the presence of pγ-interactions comes from the strong gamma-ray flare observed at the time of the neutrino event. Since the classification of PKS 0215+015 between FSRQ and BL Lac is uncertain and the source previously showed a changing-look AGN behavior (e.g., Foschini et al. 2022), there are multiple possibilities for the target photon field: External photons from the accretion disk or broad line region are abundant in FSRQ-type sources, but also jet–star interactions have been suggested (e.g., Fichet de Clairfontaine et al. 2025). However, the presence of fast moving shocks and stationary jet components at the same time possibly suggests a multi-layered jet configuration in PKS 0215+015. The shock–shock interaction between component 1 and component 3, happening almost simultaneous to the time of neutrino arrival (see Fig. 7) could present a scenario where a slower jet region acts as the target photon field for the relativistic protons that are accelerated in a faster shock region (e.g., Ghisellini et al. 2005; Tavecchio et al. 2014; Tavecchio & Ghisellini 2015). While we cannot resolve the detailed jet structure of PKS 0215+015 due to its high redshift and small viewing angle, such a configuration would be consistent with our findings and has already been suggested for other neutrino-candidate blazars. Ansoldi et al. (2018) were able to explain the neutrino emission in TXS 0506+056 using a multi-layered spine-sheath model, but also for sources such as PKS 1424+240 and PKS 0735+178 a multi-layered jet configuration seems possible (Kovalev et al. 2025; Kim & Kim 2025; Paraschos et al. 2025). In the latter case, however, studies of the multiwavelength spectral energy distribution prefer external target photon fields (Acharyya et al. 2023; Sahakyan et al. 2023; Prince et al. 2024). Additional insights on the nature of the target photon field in PKS 0215+015 could come from similar modeling approaches in the future, if applied to the available multiwavelength data.
4.3. Significance of the neutrino association
The significance of the association between high-energy neutrino events and astrophysical sources can be addressed in different ways, and using different strategies. Several studies have previously focused on crossmatching various types of source catalogs with neutrino events (e.g., Plavin et al. 2020, 2021, 2023; Buson et al. 2022; Garrappa et al. 2024; Hori et al. 2025), but also individual source flares were investigated (e.g., Kadler et al. 2016; IceCube Collaboration 2018a). In order to estimate the significance of the correlation between the flare in PKS 0215+015 and the neutrino event IC220225A we consider the arrival time of the neutrino in correlation to the monthly binned Fermi/LAT light curve. The maximum of the Fermi/LAT light curve occurs immediately following the neutrino arrival time. Assuming the null hypothesis that the neutrino arrival time is uncorrelated with the light curve peak, the probability of such a coincidence occurring by chance is p = 1/194 ≈ 0.52%, with 194 light curve bins. This corresponds to a nominal significance of ∼2.6σ under Gaussian statistics. This significance needs to be corrected for the number of trials. In order to estimate the trial factor, we used all IceCube track alerts published since introduction of the real time alert system in June 2019 (Blaufuss et al. 2019) until June 2024. This comprises a total of 137 IceCube neutrinos. For each event, we considered the uncertainty boxes as published in the GCN circulars by IceCube, and crossmatched them with sources from the 4FGL-DR3 catalog. We find 61 neutrino events without a 4FGL source, 20 events with one source, 17 events with two sources, 10 events with three sources, and 29 events with more than three sources. Similar to the approach by Garrappa et al. (2024), in the following, we consider only well localized events, i.e., events with less than three 4FGL sources in the field. Inside these 108 events, we find a total number of 84 4FGL sources, of which only 20 have available light curves in the Fermi/LAT light curve repository (i.e., their variability index is > 21.67, see Abdollahi et al. 2023). This means the obtained pre-trial p-value of 0.0052 needs to be corrected by a trial factor of 20, resulting in a post-trial p-value of 10%, equivalent to a significance of 1.27σ.
During the crossmatching of the Fermi/LAT light curves with the neutrino arrival times, we noticed two additional coincidences between historical gamma-ray flares and neutrino arrival times in the sources 4FGL J0105.1+3929 (IC230511A) and 4FGL J2049.9+1002 (IC231211A), shown in Fig. 8. For both sources, the historical gamma-ray flux maximum was observed ±3 monthly bins away from the neutrino arrival time. Including PKS 0215+015 this adds up to three out of 20 sources exhibiting their historical gamma-ray flux peak within three months of a spatially coincident neutrino event. Similar to the single-source estimate for PKS 0215+015, we estimated the chance coincidence that the arrival times of the high-energy neutrinos are uncorrelated to the flux-maxima within ±3 monthly bins. For a single light curve, the pre-trial p-value is p = 6/194 ≈ 3.1% (three bins before and three bins after the neutrino). In order to test the null-hypothesis that three or more such detections happen by chance, we described the system as a binomial process:
 (7)
(7)
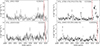 |
Fig. 8. Monthly binned gamma-ray light curves of additional neutrino-candidate sources obtained from the Fermi/LAT light curve repository. All sources show historical gamma-ray flares in temporal (±3 months) and spatial proximity with IceCube neutrino events. The two sources shown on the left are located inside the 90% confidence regions of their respective neutrino events. The two sources shown on the right are located slightly outside of the listed neutrino events, but are discussed as likely associations in the literature. |
where n is the number of light curves analyzed (here, n = 20), k is the number of historical flares within ±3 monthly bins of the neutrino arrival time, and p is the single light curve p-value (here, p = 3.1%). The probability of finding three or more such coincidences by chance can be calculated with
 (8)
(8)
This corresponds to a significance of 2σ, likely linking the historical flares to the neutrino arrival times. Additional evidence comes from the neutrino-candidate blazars PKS 0735+178 (IC211208A, e.g., Garrappa et al. 2024) and PKS 0446+112 (IC240105A, e.g., Sinapius et al. 2024), shown in Fig. 8. They are formally located slightly outside of the GCN neutrino regions, but showed strong gamma-ray flaring in temporal coincidence with neutrino events, similar to PKS 0215+015. Due to their location slightly outside of IceCube uncertainty regions, it is difficult to include them into our significance estimate. Moreover, a strong gamma-ray outburst was also observed in the first neutrino blazar, TXS 0506+056 (IceCube Collaboration 2018a), providing a strong link between gamma-ray flares in blazars and neutrino-emission.
Additionally, we emphasize that the reported physical properties of the jet (small inclination angle and rapid jet ejection with high Lorentz factor) provide strong evidence of the connection of PKS 0215+015 with neutrino event IC220225A that cannot be expressed in terms of a statistical significance value.
5. Summary and outlook
We observed the blazar PKS 0215+015 (z = 1.72) in response to a major multiwavelength outburst that happened simultaneous to the spatially coincident neutrino track-alert IC220225A. Our VLBA kinematic analysis revealed the ejection of a rapid new jet component with apparent speed βapp ∼ 60 − 80 c. In addition to this fast component, we also observed two stationary features in the jet, located within < 0.3 mas (< 100 pc de-projected) from the core. Shortly after the rapid ejection, we found a characteristic signature in fractional polarization, which first showed a significant increase and then a sudden drop, associated with a rotation of the EVPA. We interpret this behavior as a shock–shock interaction of the new-born component with a stationary feature of perpendicular EVPA which results in a fast depolarization and net EVPA rotation as the fast component passes through it. We used radio monitoring data from the TELAMON and ATCA monitoring programs to estimate the variability Doppler factor related to the strong radio flare. Using this information, we estimated the bulk Lorentz factor of the fast component Γ = 105 ± 56, and the jet viewing angle ϑ = (1.47 ± 0.31)° of PKS 0215+015. We note that the observed apparent speed, and as a result the Lorentz factor, is higher than the maximum values reported by continuous AGN VLBI monitoring programs (Lister et al. 2021; Weaver et al. 2022). The measurement of such high jet speeds is likely only possible in the aftermath of exceptional flares and with high-cadence (i.e., ≲ monthly) observations. Additionally, the high redshift leads to a “slow-motion” effect, i.e., fast features with an apparent speed of 60 − 80 c are seen at angular speeds of only ∼0.8−1.0 mas/yr. In the local universe (z ∼ 0.1), such fast features would appear about an order of magnitude faster which makes them challenging to trace with typical VLBI monitoring cadences of months to years. Dense polarization monitoring programs such as TELAMON are therefore crucial as an additional tracer of the underlying jet dynamics. Even though the chance coincidence between the neutrino event and the historical gamma-ray flare is not negligible (∼10% post-trial), the rapid jet ejection and shock–shock interaction close in time to the neutrino provide additional physical hints for the connection of jet activity and neutrino production that cannot be expressed as a significance value. Proton acceleration can in principle happen in the relativistic shocks close to the core (cf., Plavin et al. 2021). However, the target photon field for the pγ-process remains less constrained in our study. The presence of quasi-stationary and rapid jet components at the same time as revealed in our kinematic study could suggest a multi-layered jet configuration, where the slower jet regions provide the target photon field for the pγ-process (e.g., Ghisellini et al. 2005; Tavecchio et al. 2014; Tavecchio & Ghisellini 2015), but also target photon fields external to the jet are possible. Our study shows that rapid, possibly short-lived components can be ejected in response to major flares in blazars, exceeding speeds usually reported by VLBI monitoring programs. Such a scenario would present a solution to the bulk Lorentz-factor crisis, also called “Doppler crisis” (Henri & Saugé 2006) for TeV-emitting blazars. The high Lorentz factors usually suggested by TeV observations could be matched by the high Lorentz factors associated with fast ejections in response to major flares. While PKS 0215+015 is not yet detected at TeV-energies (likely due to its high redshift, e.g., Aharonian et al. 2006), and thus not affected by the Doppler crisis, triggered, dense VLBI follow-up observations of flaring Doppler crisis blazars should be able to reveal similarly fast features, if they exist in these sources.
Data availability
The VLBI data are available on zenodo (https://doi.org/10.5281/zenodo.17913817) including full-polarization maps, self-calibrated uv-fits files and modelfit files.
Acknowledgments
We thank the anonymous referee for valuable comments that helped us improve the manuscript. This work is based on observations with the 100-m telescope of the MPIfR (Max-Planck-Institut für Radioastronomie) at Effelsberg. FE, MK, JH, and FR acknowledge support from the German Science Foundation (DFG, grants 447572188, 434448349, 465409577, 443220636 [FOR5195: Relativistic Jets in Active Galaxies]) and the German Aerospace Center (DLR, grant 50OR2506). SH is partly supported by the German Science Foundation (DFG grant numbers WI 1860/14-1 and 434448349). We acknowledge the M2FINDERS project from the European Research Council (ERC) under the European Union’s Horizon 2020 research and innovation programme (grant agreement No 101018682). YYK was supported by the MuSES project, which has received funding from the European Union (ERC grant agreement No 101142396). Views and opinions expressed are those of the authors only and do not necessarily reflect those of the European Union or ERCEA. Neither the European Union nor the granting authority can be held responsible for them. This research has made use of the Astrophysics Data System, funded by NASA under Cooperative Agreement 80NSSC21M00561. The VLBA is an instrument of the National Radio Astronomy Observatory. The National Radio Astronomy Observatory and Green Bank Observatory are facilities of the U.S. National Science Foundation operated under cooperative agreement by Associated Universities, Inc. This work made use of the Swinburne University of Technology software correlator, developed as part of the Australian Major National Research Facilities Programme and operated under licence (Deller et al. 2011). The Australia Telescope Compact Array is part of the Australia Telescope National Facility (https://ror.org/05qajvd42) which is funded by the Australian Government for operation as a National Facility managed by CSIRO. We acknowledge the Gomeroi people as the Traditional Owners of the Observatory site. This research has made use of data from the MOJAVE database that is maintained by the MOJAVE team (Lister et al. 2018). This study makes use of VLBA data from the VLBA-BU Blazar Monitoring Program (BEAM-ME and VLBA-BU-BLAZAR; http://www.bu.edu/blazars/BEAM-ME.html), funded by NASA through the Fermi Guest Investigator Program.
References
- Abbasi, R., Ackermann, M., Adams, J., et al. 2023a, ApJ, 954, 75 [NASA ADS] [CrossRef] [Google Scholar]
- Abbasi, R., Ackermann, M., Adams, J., et al. 2023b, ApJS, 269, 25 [CrossRef] [Google Scholar]
- Abdollahi, S., Acero, F., Baldini, L., et al. 2022, ApJS, 260, 53 [NASA ADS] [CrossRef] [Google Scholar]
- Abdollahi, S., Ajello, M., Baldini, L., et al. 2023, ApJS, 265, 31 [NASA ADS] [CrossRef] [Google Scholar]
- Acharyya, A., Adams, C. B., Archer, A., et al. 2023, ApJ, 954, 70 [NASA ADS] [CrossRef] [Google Scholar]
- Aharonian, F., Akhperjanian, A. G., Bazer-Bachi, A. R., et al. 2006, Nature, 440, 1018 [Google Scholar]
- Ansoldi, S., Antonelli, L. A., Arcaro, C., et al. 2018, ApJ, 863, L10 [Google Scholar]
- Atoyan, A., & Dermer, C. D. 2001, Phys. Rev. Lett., 87, 221102 [CrossRef] [PubMed] [Google Scholar]
- Baczko, A. K., Eppel, F., Bartolini, V., et al. 2025, https://doi.org/10.5281/zenodo.17404907 [Google Scholar]
- Bellenghi, C., Padovani, P., Resconi, E., & Giommi, P. 2023, ApJ, 955, L32 [NASA ADS] [CrossRef] [Google Scholar]
- Blades, J. C., Hunstead, R. W., Murdoch, H. S., & Pettini, M. 1985, ApJ, 288, 580 [Google Scholar]
- Blaufuss, E., Kintscher, T., Lu, L., & Tung, C. F. 2019, 36th International Cosmic Ray Conference, ICRC2019), 36, 1021 [Google Scholar]
- Buson, S., Tramacere, A., Pfeiffer, L., et al. 2022, ApJ, 933, L43 [NASA ADS] [CrossRef] [Google Scholar]
- CASA Team (Bean, B., et al.) 2022, PASP, 134, 114501 [NASA ADS] [CrossRef] [Google Scholar]
- Chamani, W., Savolainen, T., Ros, E., et al. 2023, A&A, 672, A130 [NASA ADS] [CrossRef] [EDP Sciences] [Google Scholar]
- Deller, A. T., Brisken, W. F., Phillips, C. J., et al. 2011, PASP, 123, 275 [Google Scholar]
- Eppel, F., Kadler, M., Ros, E., et al. 2023, IAU Symp., 375, 91 [NASA ADS] [Google Scholar]
- Eppel, F., Kadler, M., Debbrecht, L., et al. 2024a, ATel, 16399, 1 [Google Scholar]
- Eppel, F., Kadler, M., Heßdörfer, J., et al. 2024b, A&A, 684, A11 [NASA ADS] [CrossRef] [EDP Sciences] [Google Scholar]
- Fichet de Clairfontaine, G., Perucho, M., & Martí, J. M. 2025, MNRAS, 544, 4217 [Google Scholar]
- Foltz, C. B., & Chaffee, F. H., Jr 1987, AJ, 93, 529 [Google Scholar]
- Foschini, L., Lister, M. L., Andernach, H., et al. 2022, Universe, 8, 587 [NASA ADS] [CrossRef] [Google Scholar]
- Fromm, C. M., Ros, E., Perucho, M., et al. 2013, A&A, 551, A32 [NASA ADS] [CrossRef] [EDP Sciences] [Google Scholar]
- Fujisawa, K., Kobayashi, H., Wajima, K., et al. 1999, PASJ, 51, 537 [NASA ADS] [Google Scholar]
- Garrappa, S., Buson, S., Cheung, C. C., Sinapius, J., & Fermi-LAT Collaboration 2022, GRB Coordinates Network, 31653, 1 [Google Scholar]
- Garrappa, S., Buson, S., Sinapius, J., et al. 2024, A&A, 687, A59 [NASA ADS] [CrossRef] [EDP Sciences] [Google Scholar]
- Gaskell, C. M. 1982, ApJ, 252, 447 [Google Scholar]
- Ghisellini, G., Tavecchio, F., & Chiaberge, M. 2005, A&A, 432, 401 [CrossRef] [EDP Sciences] [Google Scholar]
- Greisen, E. W. 1990, in Acquisition, Processing and Archiving of Astronomical Images, eds. G. Longo, & G. Sedmak, 125 [Google Scholar]
- Henri, G., & Saugé, L. 2006, ApJ, 640, 185 [NASA ADS] [CrossRef] [Google Scholar]
- Hessdoerfer, J., Kadler, M., Benke, P., et al. 2023, PoS, ICRC2023, 1545 [Google Scholar]
- Homan, D. C., Kovalev, Y. Y., Lister, M. L., et al. 2006, ApJ, 642, L115 [NASA ADS] [CrossRef] [Google Scholar]
- Homan, D. C., Cohen, M. H., Hovatta, T., et al. 2021, ApJ, 923, 67 [NASA ADS] [CrossRef] [Google Scholar]
- Homan, D. C., Roth, J. S., & Pushkarev, A. B. 2024, AJ, 167, 11 [Google Scholar]
- Hori, S., Desai, A., & Vandenbroucke, J. 2025, ArXiv e-prints [arXiv:2507.07098] [Google Scholar]
- Hovatta, T., Valtaoja, E., Tornikoski, M., & Lähteenmäki, A. 2009, A&A, 494, 527 [CrossRef] [EDP Sciences] [Google Scholar]
- Hovatta, T., Lindfors, E., Kiehlmann, S., et al. 2021, A&A, 650, A83 [NASA ADS] [CrossRef] [EDP Sciences] [Google Scholar]
- IceCube Collaboration (Aartsen, M. G., et al.) 2018a, Science, 361, eaat1378 [NASA ADS] [Google Scholar]
- IceCube Collaboration (Aartsen, M. G., et al.) 2018b, Science, 361, 147 [NASA ADS] [Google Scholar]
- IceCube Collaboration (Abbasi, R., et al.) 2022, Science, 378, 538 [CrossRef] [PubMed] [Google Scholar]
- IceCube Collaboration (Abbasi, R., et al.) 2023, Science, 380, 1338 [NASA ADS] [CrossRef] [Google Scholar]
- Janssen, M., Goddi, C., van Bemmel, I. M., et al. 2019, A&A, 626, A75 [NASA ADS] [CrossRef] [EDP Sciences] [Google Scholar]
- Ji, S., & Wang, Z. 2024, ApJ, 975, L30 [Google Scholar]
- Jiang, X., Liao, N.-H., Wang, Y.-B., et al. 2024, ApJ, 965, L2 [Google Scholar]
- Jorstad, S. G., Marscher, A. P., Mattox, J. R., et al. 2001a, ApJ, 556, 738 [NASA ADS] [CrossRef] [Google Scholar]
- Jorstad, S. G., Marscher, A. P., Mattox, J. R., et al. 2001b, ApJS, 134, 181 [Google Scholar]
- Kadler, M., Krauß, F., Mannheim, K., et al. 2016, Nat. Phys., 12, 807 [Google Scholar]
- Kadler, M., Benke, P., Gokus, A., et al. 2021, ATel, 15105, 1 [Google Scholar]
- Kadler, M., Stevens, J., Ojha, R., & Edwards, P. G. 2022, ATel, 15245, 1 [Google Scholar]
- Kalashev, O., Kivokurtseva, P., & Troitsky, S. 2023, JCAP, 2023, 007 [Google Scholar]
- Kettenis, M., van Langevelde, H. J., Reynolds, C., & Cotton, B. 2006, ASP Conf. Ser., 351, 497 [NASA ADS] [Google Scholar]
- Kőmíves, J., Gabányi, K. É., Frey, S., & Kun, E. 2024, Universe, 10, 78 [Google Scholar]
- Kim, S., Lee, S. S., Cheong, W. Y., & Jeong, H. W. 2024, in Proceedings of the 16th EVN Symposium, eds. E. Ros, P. Benke, S. A. Dzib, I. Rottmann, & J. A. Zensus, 123 [Google Scholar]
- Kim, Y.-S., & Kim, J.-Y. 2025, A&A, 699, A381 [NASA ADS] [CrossRef] [EDP Sciences] [Google Scholar]
- Kouch, P. M., Lindfors, E., Hovatta, T., et al. 2024, A&A, 690, A111 [NASA ADS] [CrossRef] [EDP Sciences] [Google Scholar]
- Kovalev, Y. Y., Kellermann, K. I., Lister, M. L., et al. 2005, AJ, 130, 2473 [Google Scholar]
- Kovalev, Y. Y., Lobanov, A. P., Pushkarev, A. B., & Zensus, J. A. 2008, A&A, 483, 759 [NASA ADS] [CrossRef] [EDP Sciences] [Google Scholar]
- Kovalev, Y. Y., Pushkarev, A. B., Nokhrina, E. E., et al. 2020, MNRAS, 495, 3576 [NASA ADS] [CrossRef] [Google Scholar]
- Kovalev, Y. Y., Plavin, A. V., Troitsky, S. V., et al. 2024, ATel, 16409, 1 [Google Scholar]
- Kovalev, Y. Y., Pushkarev, A. B., Gómez, J. L., et al. 2025, A&A, 700, L12 [NASA ADS] [CrossRef] [EDP Sciences] [Google Scholar]
- Kovalev, Y. Y., Aller, M. F., Erkenov, A. K., et al. 2026, in press, https://doi.org/10.1051/0004-6361/202558005 [Google Scholar]
- Lähteenmäki, A., & Valtaoja, E. 1999, ApJ, 521, 493 [Google Scholar]
- Lahteenmaki, A., Valtaoja, E., & Wiik, K. 1999, ApJ, 511, 112 [CrossRef] [Google Scholar]
- Lara, L., Alberdi, A., & Marcaide, J. M. 2001, A&A, 368, 817 [NASA ADS] [CrossRef] [EDP Sciences] [Google Scholar]
- Liodakis, I., Marchili, N., Angelakis, E., et al. 2017, MNRAS, 466, 4625 [NASA ADS] [CrossRef] [Google Scholar]
- Liodakis, I., Blinov, D., Jorstad, S. G., et al. 2020, ApJ, 902, 61 [NASA ADS] [CrossRef] [Google Scholar]
- Lister, M. L., & Homan, D. C. 2005, AJ, 130, 1389 [NASA ADS] [CrossRef] [Google Scholar]
- Lister, M. L., Aller, M. F., Aller, H. D., et al. 2018, ApJS, 234, 12 [CrossRef] [Google Scholar]
- Lister, M. L., Homan, D. C., Hovatta, T., et al. 2019, ApJ, 874, 43 [NASA ADS] [CrossRef] [Google Scholar]
- Lister, M. L., Homan, D. C., Kellermann, K. I., et al. 2021, ApJ, 923, 30 [NASA ADS] [CrossRef] [Google Scholar]
- Livingston, J. D., Nikonov, A. S., Dzib, S. A., et al. 2025, A&A, 700, C4 [NASA ADS] [CrossRef] [EDP Sciences] [Google Scholar]
- Lobanov, A. P. 1998, A&A, 330, 79 [NASA ADS] [Google Scholar]
- Lobanov, A. P. 2005, ArXiv e-prints [arXiv:astro-ph/0503225] [Google Scholar]
- Mannheim, K. 1993, A&A, 269, 67 [NASA ADS] [Google Scholar]
- Mannheim, K. 1995, Astropart. Phys., 3, 295 [NASA ADS] [CrossRef] [Google Scholar]
- Marscher, A. P., & Gear, W. K. 1985, ApJ, 298, 114 [Google Scholar]
- Martí-Vidal, I., Mus, A., Janssen, M., de Vicente, P., & González, J. 2021, A&A, 646, A52 [NASA ADS] [CrossRef] [EDP Sciences] [Google Scholar]
- Moretti, A., & Caccianiga, A. 2025, A&A, 704, A184 [NASA ADS] [CrossRef] [EDP Sciences] [Google Scholar]
- Murase, K., Inoue, Y., & Dermer, C. D. 2014, Phys. Rev. D, 90, 023007 [Google Scholar]
- Nanci, C., Giroletti, M., Orienti, M., et al. 2022, A&A, 663, A129 [NASA ADS] [CrossRef] [EDP Sciences] [Google Scholar]
- Nesci, R. 2022, ATel, 15248, 1 [Google Scholar]
- Oikonomou, F. 2022, in 37th International Cosmic Ray Conference, 30 [Google Scholar]
- Oikonomou, F., Murase, K., Padovani, P., Resconi, E., & Mészáros, P. 2019, MNRAS, 489, 4347 [Google Scholar]
- Paraschos, G. F. 2025, A&A, 695, L3 [NASA ADS] [CrossRef] [EDP Sciences] [Google Scholar]
- Paraschos, G. F., Traianou, E., Debbrecht, L. C., Liodakis, I., & Ros, E. 2025, ApJ, 989, 208 [Google Scholar]
- Perger, K., Frey, S., Gabányi, K. É., & Kun, E. 2025, A&A, 698, L2 [NASA ADS] [CrossRef] [EDP Sciences] [Google Scholar]
- Petrov, L. Y., & Kovalev, Y. Y. 2025, ApJS, 276, 38 [NASA ADS] [CrossRef] [Google Scholar]
- Planck Collaboration VI 2020, A&A, 641, A6 [NASA ADS] [CrossRef] [EDP Sciences] [Google Scholar]
- Plavin, A. V., Kovalev, Y. Y., Pushkarev, A. B., & Lobanov, A. P. 2019, MNRAS, 485, 1822 [Google Scholar]
- Plavin, A., Kovalev, Y. Y., Kovalev, Y. A., & Troitsky, S. 2020, ApJ, 894, 101 [Google Scholar]
- Plavin, A. V., Kovalev, Y. Y., Kovalev, Y. A., & Troitsky, S. V. 2021, ApJ, 908, 157 [Google Scholar]
- Plavin, A. V., Kovalev, Y. Y., Troitsky, S. V., et al. 2022, ATel, 15247, 1 [Google Scholar]
- Plavin, A. V., Kovalev, Y. Y., Kovalev, Y. A., & Troitsky, S. V. 2023, MNRAS, 523, 1799 [NASA ADS] [CrossRef] [Google Scholar]
- Pollack, L. K., Taylor, G. B., & Zavala, R. T. 2003, ApJ, 589, 733 [Google Scholar]
- Prince, R., Das, S., Gupta, N., Majumdar, P., & Czerny, B. 2024, MNRAS, 527, 8746 [Google Scholar]
- Pushkarev, A. B., Kovalev, Y. Y., Lister, M. L., & Savolainen, T. 2009, A&A, 507, L33 [NASA ADS] [CrossRef] [EDP Sciences] [Google Scholar]
- Pushkarev, A. B., Kovalev, Y. Y., Lister, M. L., & Savolainen, T. 2017, MNRAS, 468, 4992 [Google Scholar]
- Readhead, A. C. S. 1994, ApJ, 426, 51 [Google Scholar]
- Sahakyan, N., Giommi, P., Padovani, P., et al. 2023, MNRAS, 519, 1396 [Google Scholar]
- Savolainen, T., Wiik, K., Valtaoja, E., Jorstad, S. G., & Marscher, A. P. 2002, A&A, 394, 851 [NASA ADS] [CrossRef] [EDP Sciences] [Google Scholar]
- Schinzel, F. K., Lobanov, A. P., Taylor, G. B., et al. 2012, A&A, 537, A70 [NASA ADS] [CrossRef] [EDP Sciences] [Google Scholar]
- Sebastian, B., Kharb, P., Lister, M. L., et al. 2022, ApJ, 935, 59 [Google Scholar]
- Shepherd, M. C. 1997, ASP Conf. Ser., 125, 77 [Google Scholar]
- Sinapius, J., Garrappa, S., Buson, S., et al. 2024, GRB Coordinates Network, 35517, 1 [Google Scholar]
- Stevens, J., Edwards, P. G., Ojha, R., et al. 2012, ArXiv e-prints [arXiv:1205.2403] [Google Scholar]
- Sumida, V. Y. D., Schutzer, A. A., Caproni, A., & Abraham, Z. 2022, MNRAS, 509, 1646 [Google Scholar]
- Tavecchio, F., & Ghisellini, G. 2015, MNRAS, 451, 1502 [CrossRef] [Google Scholar]
- Tavecchio, F., Ghisellini, G., & Guetta, D. 2014, ApJ, 793, L18 [NASA ADS] [CrossRef] [Google Scholar]
- Weaver, Z. R., Jorstad, S. G., Marscher, A. P., et al. 2022, ApJS, 260, 12 [NASA ADS] [CrossRef] [Google Scholar]
Appendix A: Collimation profile fit
In order to probe the collimation profile of PKS 0215+015, we fit a power law of the form
 (A.1)
(A.1)
where w0 is the jet width 1 mas from the jet apex, r is the distance of a component to the radio core, r0 the distance from the radio core to the jet apex, and k the power law/collimation index (see Fig. A.1). We excluded any unresolved components, following the definition by Lobanov (2005) and Kovalev et al. (2005), as well as the core components from the fit. The fit suggest a collimation index of k = 1.17 ± 0.30, which is consistent with a conical jet profile (i.e., k∼1). Additionally, we find w0 = (0.80 ± 0.23) mas, and r0 = (0.045 ± 0.039) mas. In principle one has to consider the core shift effect due to synchrotron opacity (Lobanov 1998; Kovalev et al. 2008) before performing a combined fit of the collimation profile across frequencies. However, due to the compact nature of the source, as well as its large redshift, the core shift cannot be reliably estimated. Given the component cross identifications across frequencies (see App. B), no significant systematic shift across frequencies is evident from the optically thin components 1 and 2. Therefore, the core-shift is expected to be very small, which is consistent with the small value obtained for r0.
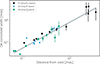 |
Fig. A.1. Collimation profile obtained from the combined VLBI data at 15 GHz (Ku-band), 23 GHz (K-band), and 43 GHz (Q-band). |
Appendix B: Component identification
In this section, we provide a detailed overview about the obtained modelfits and their identification across epochs and frequencies. The positions, sizes, flux densities, and S/N values for all components are listed in Tab. B.1. Figure B.1 shows the position of the core component (component 0), as well as the jet components 1−4 for all epochs and frequencies, on top of the total intensity maps. The component identification for this dataset is not trivial since in several epochs, multiple components are located within the size of the beam. The presented modelfit represents the most consistent model that we obtained across all epochs and frequencies.
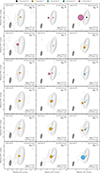 |
Fig. B.1. Total intensity contour plots, as shown in Fig. 6. Contours start at four times the noise level, increasing by a factor of two. The core component (component 0), and the modelfit components 1−4 are plotted on top of the contours, with their size corresponding to the full width at half maximum of the modelfit component. The reduced-χ2 value for the modelfit is shown in each panel. For unresolved components, the plotted component size corresponds to the resolution limit. |
Modelfit component parameters for all epochs and frequencies.
In the first epoch, on March 24, 2022, at 15 GHz and 43 GHz, only two components are detected, while at 23 GHz, three components are found. We decided to label the component furthest away from the core as component 4, while the component very close to the core is labeled as component 1. It is not clear, why component 1 cannot be fit at 43 GHz in this epoch, but we note the extended core size in this observation, and thus it might be blended with the core component. Similarly, component 4 could not be fit at 15 GHz, likely due to the limited resolution in this epoch, since the HN station of the VLBA had to be flagged for most of the observation.
In the second epoch, on April 23, 2022, at 15 GHz, we can detect only the core component and one extended component, located at a distance of ∼0.8 mas away from the core. This extended component is clearly not consistent with component 1 that was detected in the previous epoch and was thus identified as component 4, which was already found at 23 GHz and 43 GHz in the previous epoch at a similar core distance. At 23 GHz, component 1 and the core are clearly detected, while the extended component 4 was not detected, likely due to limited S/N. At 43 GHz a consistent component 1 was found, as well as a new component very close to the core, that we labeled as component 3.
In Epoch 3, on June 1, 2022, at 15 GHz, again, the outermost component 4 is not detected, but a component consistent with the position of component 1 was found, in addition to the core component. At 23 GHz we identified three components, in addition to the core component. The outermost component is consistent with the position of component 4, while the next component upstream must be labeled component 1, given its position at 15 GHz. Additionally, this introduces a new component 2, located close to the 23 GHz core. At 43 GHz, only one jet component is detected in addition to the core. While this component could be consistent with component 1, we decided to assign it to component 2, which is more consistent with the 23 GHz modelfit and the modelfits of the later 43 GHz epochs (see also Fig. 4).
In Epoch 4, on June 30, 2022, a new component also appears at 15 GHz, which is blended with the core component. This component was already visible in the previous epoch with better resolution at the higher frequencies and must therefore be consistent with component 2. The other detected jet component is clearly associated with component 1. A similar picture is seen at 23 GHz, with component 2 located a bit further from the core than at 15 GHz, but also component 1 being clearly detected. At 43 GHz, another component shows up very close to the core which was detected before in Epoch 2 as component 3.
Epoch 5, observed on August 1, 2022 is largely consistent with Epoch 4, with only minor changes of the component positions between these two epochs at all frequencies.
At the final epoch, observed on 19 August 2022, there are again no major changes at 15 GHz and 23 GHz compared to the previous epoch. At 43 GHz, the component labeled as component 2 is likely a combination of component 1 and component 2, and thus it has a large positional uncertainty (see also Fig. 4). We decided to label it as component 2, since its position is more consistent with the position of component 2 detected at the other frequencies.
The strongest evidence for the fast motion of component 1 clearly comes from 15 GHz and 23 GHz, while the structure at 43 GHz is less constrained by the modelfits. This might seem contradictory since 43 GHz offers the best angular resolution. However, due to the limited S/N as compared to the lower frequencies, as well as the detection of an additional component close to the core, the cross-identification of components at 43 GHz is especially challenging.
All Tables
Scaling factors used to adjust the VLBA flux densities to single-dish measurements.
All Figures
|
Fig. 1. Uncertainty regions of the neutrino IC220225A (90% confidence) as reported by the IceCube Collaboration via AMON (black dashed line) and GCN circular (blue ellipse and red dashed box). RFC sources within the GCN box region are displayed as black dots. Gamma-ray detected sources from the 4FGL catalog are highlighted as green stars. PKS 0215+015 stands out as the only gamma-ray detected source within all three regions. |
| In the text | |
|
Fig. 2. Gamma-ray (upper panel) and radio (lower panel) light curves of PKS 0215+015. The source exhibited its historical high-state in both wavelengths coincident with the arrival time of IceCube neutrino event IC220224A (dashed red line). The new fast component 1 was ejected shortly before. Its possible ejection time range (1σ) is indicated by the gray shaded area. |
| In the text | |
|
Fig. 3. Stacked polarization images at 15 GHz (left), 23 GHz (center), and 43 GHz (right). Before stacking, the individual images were convolved with the median beam (indicated by the gray ellipse) at each frequency separately. Contours show the total intensity, starting at four times the noise level and increasing by factors of two. The color map displays linear polarization, and the sticks indicate the direction of the EVPA. |
| In the text | |
|
Fig. 4. Kinematic modeling of PKS 0215+015 at 15 GHz (left), 23 GHz (center), and 43 GHz (right). Component 1 is moving outwards, while components 2 and 3 are quasi-stationary. Fit parameters for all components at all frequencies are shown in Table 2. |
| In the text | |
|
Fig. 5. Top: combined ATCA and TELAMON light curve with flare fits. Center: TELAMON fractional polarization at 20 mm and 7 mm. The inclined lines indicate the direction of the EVPA; errors are indicated by the shaded regions in EVPA and polarization. In addition to the TELAMON polarization values, we display the fractional polarization and EVPA of the VLBA data, for better visibility without uncertainties. Bottom: spectral index evolution obtained from TELAMON observations between 20 mm and 7 mm. The dashed red line indicates the time of IC220225A. |
| In the text | |
|
Fig. 6. Full polarization VLBI images of PKS 0215+015 from the conducted ToO campaign, convolved with the median beam for each frequency. The color map indicates linear polarized intensity. Contours correspond to total intensity and start at five times the noise level, increasing by factors of two. The direction of the EVPA is indicated by the tilted lines. |
| In the text | |
|
Fig. 7. Combined kinematic fit from 15 GHz, 23 GHz, and 43 GHz for component 1, 2, and 3. The solid line indicates the best fit. For component 1, the dash-dotted lines represent the 1σ fit bounds, and the shaded area in the background reflects the confidence range of the fit. The time of arrival of the neutrino event IC220225A is indicated by the dashed red line and coincides with the passage of component 1 through component 3. |
| In the text | |
|
Fig. 8. Monthly binned gamma-ray light curves of additional neutrino-candidate sources obtained from the Fermi/LAT light curve repository. All sources show historical gamma-ray flares in temporal (±3 months) and spatial proximity with IceCube neutrino events. The two sources shown on the left are located inside the 90% confidence regions of their respective neutrino events. The two sources shown on the right are located slightly outside of the listed neutrino events, but are discussed as likely associations in the literature. |
| In the text | |
|
Fig. A.1. Collimation profile obtained from the combined VLBI data at 15 GHz (Ku-band), 23 GHz (K-band), and 43 GHz (Q-band). |
| In the text | |
|
Fig. B.1. Total intensity contour plots, as shown in Fig. 6. Contours start at four times the noise level, increasing by a factor of two. The core component (component 0), and the modelfit components 1−4 are plotted on top of the contours, with their size corresponding to the full width at half maximum of the modelfit component. The reduced-χ2 value for the modelfit is shown in each panel. For unresolved components, the plotted component size corresponds to the resolution limit. |
| In the text | |
Current usage metrics show cumulative count of Article Views (full-text article views including HTML views, PDF and ePub downloads, according to the available data) and Abstracts Views on Vision4Press platform.
Data correspond to usage on the plateform after 2015. The current usage metrics is available 48-96 hours after online publication and is updated daily on week days.
Initial download of the metrics may take a while.