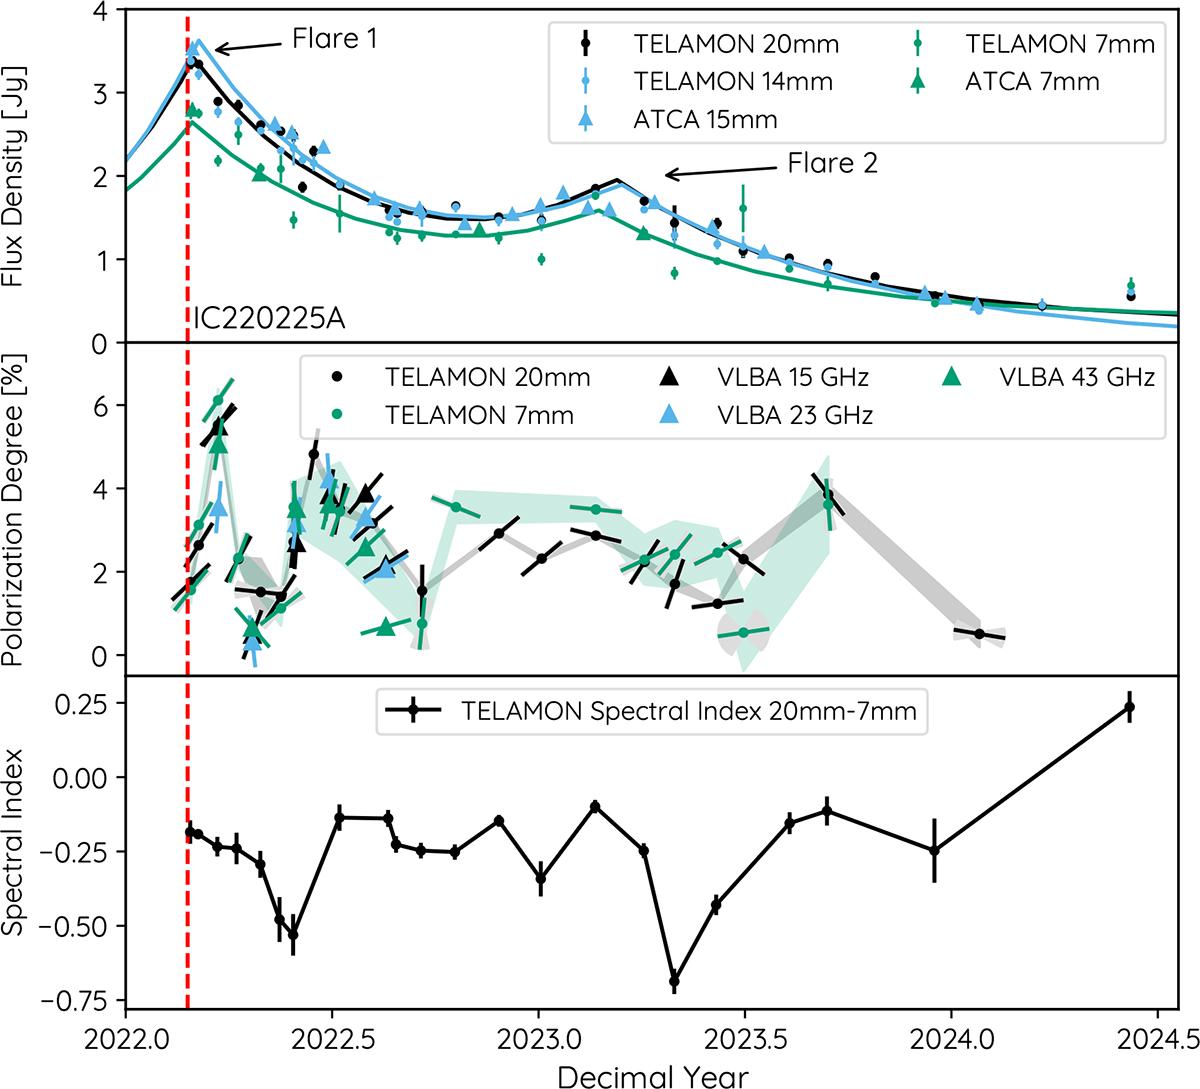
Fig. 5.
Download original image
Top: combined ATCA and TELAMON light curve with flare fits. Center: TELAMON fractional polarization at 20 mm and 7 mm. The inclined lines indicate the direction of the EVPA; errors are indicated by the shaded regions in EVPA and polarization. In addition to the TELAMON polarization values, we display the fractional polarization and EVPA of the VLBA data, for better visibility without uncertainties. Bottom: spectral index evolution obtained from TELAMON observations between 20 mm and 7 mm. The dashed red line indicates the time of IC220225A.
Current usage metrics show cumulative count of Article Views (full-text article views including HTML views, PDF and ePub downloads, according to the available data) and Abstracts Views on Vision4Press platform.
Data correspond to usage on the plateform after 2015. The current usage metrics is available 48-96 hours after online publication and is updated daily on week days.
Initial download of the metrics may take a while.