| Issue |
A&A
Volume 699, July 2025
|
|
|---|---|---|
| Article Number | A381 | |
| Number of page(s) | 15 | |
| Section | Extragalactic astronomy | |
| DOI | https://doi.org/10.1051/0004-6361/202452111 | |
| Published online | 25 July 2025 | |
The dynamics of the parsec-scale jet in the neutrino blazar PKS 0735+178
1
Department of Physics, Ulsan National Institute of Science and Technology (UNIST), Ulsan 44919, Republic of Korea
2
Max-Planck-Institut für Radioastronomie, Auf dem Hügel 69, D-53121 Bonn, Germany
⋆ Corresponding author: This email address is being protected from spambots. You need JavaScript enabled to view it.
Received:
4
September
2024
Accepted:
20
May
2025
Abstract
Recent studies of individual track-like TeV-PeV IceCube neutrino events suggest that strongly jetted active galactic nuclei (AGNs), that is, blazars, can be plausible sources of extragalactic high-energy neutrinos. Although the broadband emission and neutrinos from these blazars can be modeled by hadronic jets with inverse Compton processes, the various models show degeneracies. One of the reasons is the lack of high-resolution observations that determine the location and physical conditions of neutrino-emitting plasma. We present a very long-baseline interferometry (VLBI) study of PKS 0735+178, which was recently associated with the high-energy neutrino event IceCube-211208A as well as with alerts from other neutrino observatories. We analyzed publicly available Very Long Baseline Array (VLBA) 15 and 43 GHz data of PKS 0735+178 during 2020-2024, resolved the milliarcsecond-scale jet, and traced its time evolution in flux and structure before and after the IceCube-211208A event. We find significant enhancements in the radio flux density (of about a few times compared to its last quiescent state), apparent brightness temperature (∼×10), and synchrotron opacity at 15-43 GHz of the VLBI nuclear region (spectral index α1543 ∼ −0.34 to ∼+0.07) after IceCube-211208A. This strengthens the temporal correlation between the blazar and the high-energy neutrino event. Furthermore, we find that the source ejected a new VLBI component, C2, from the VLBI core before the IceCube-211208A event. C2 traveled farther downstream at an apparent speed of ∼4.2c, which is close to the historical maximum speed for this object. C2 then passed a subluminally moving feature in the jet, C1, which was located at ∼0.13 mas (∼0.77 pc) downstream of the core at the time of IceCube-211208A. The time of this apparent passage is statistically coincident with the time of IceCube-211208A within an uncertainty of 1σ. This suggests that the location of this apparent passage might be the probable spatial origin of the IceCube-211208A event. Examination of the kinematic and emission properties of C1 and C2 reveals that it is difficult to find a single unique jet model that explains the VLBI and the broadband emission properties of PKS 0735+178 simultaneously. Furthermore, we find that the large distance to C1 (∼0.77 pc) at the time of IceCube-211208A makes it difficult to provide a sufficient background radiation field for the photo-pion process in a single-zone jet model. Models that are less sensitive to the external radiation field are therefore preferred.
Key words: neutrinos / radiation mechanisms: non-thermal / instrumentation: interferometers / galaxies: active / BL Lacertae objects: individual: PKS 0735+178
© The Authors 2025
 Open Access article, published by EDP Sciences, under the terms of the Creative Commons Attribution License (https://creativecommons.org/licenses/by/4.0), which permits unrestricted use, distribution, and reproduction in any medium, provided the original work is properly cited.
This article is published in open access under the Subscribe to Open model. This email address is being protected from spambots. You need JavaScript enabled to view it. to support open access publication.
1. Introduction
Neutrinos are fundamental, lightweight, and chargeless particles. Astrophysical neutrinos can therefore be observed with a lower opacity than is used for electromagnetic observations at all other wavelengths, and high-energy neutrinos can provide new insights into extreme physical processes in high-energy plasma that are not accessible by other methods (see, e.g., Mészáros et al. 2019; Sharma 2024). The IceCube Observatory has reported 275 individual TeV-PeV neutrinos of astrophysical origin so far (Abbasi et al. 2023).
In a limited number of cases, the counterparts of the neutrino events could be identified by temporal correlations based on monitoring and follow-up electromagnetic observations or spatial correlations using catalogs of astronomical sources at various wavelengths.
For example, the recent detection of the sub-PeV neutrino IceCube-170922A from the direction of blazar TXS 0506+056 and contemporaneous electromagnetic flares (IceCube Collaboration 2018a, b) provided the first strong evidence that active galactic nuclei (AGNs) with especially powerful jets can be sources of extragalactic neutrinos.
Studies employing statistical methods for probing the spatial and temporal correlations also suggested that AGNs with strong jets, that is, blazars, may be dominant sources of high-energy neutrino events (e.g., Giommi et al. 2020; Das et al. 2021; Plavin et al. 2021; Hovatta et al. 2021).
This suggests that the vicinity of supermassive black holes (SMBHs) or their powerful jets can provide the necessary particle acceleration, protons, and internal or external radiation fields for the production of multimessenger (i.e., high-energy neutrinos and photons) signals (see, e.g., Dermer et al. 2014; Mészáros et al. 2019 for a review).
In December 2021, the IceCube observatory detected a 172 TeV energy neutrino event IceCube-211208A (IceCube Collaboration 2021) from the direction of blazar PKS 0735+178 (SDSS J073807.39+174218.9, 4FGL J0738.1+1742) within the 90% positional error region. Similar high-energy neutrino events were detected close in time from other neutrino observatories (Baikal-GVD, Dzhilkibaev & Suvorova 2021; Baksan, Petkov et al. 2021; KM3Net, Filippini et al. 2022), which triggered follow-up observations of contemporaneous electromagnetic flares at optical, X-ray, and γ-ray energies (e.g., Sahakyan et al. 2023). All these results suggest that PKS 0735+178 is the most likely origin of the IceCube-211208A event.
Theoretical modeling of the observed broadband spectral energy density (SED) of PKS 0735+178 suggests that external inverse-Compton scattering of incident photons by a lepto-hadronic jet explains the neutrino and electromagnetic flares better than purely synchrotron self-Compton models (Acharyya et al. 2023; Prince et al. 2024; Bharathan et al. 2024). These studies are based on the source-integrated flux measurements, however, and present common difficulties in finding a unique scenario for the production of high-energy neutrinos. More specifically, the studies show that purely leptonic jets can also explain the electromagnetic spectrum well. Hadronic jets also often produce a too-large total jet power that exceeds the Eddington limit. The exact locations of the neutrino-emission regions and the properties of the seed photons are additional factors of uncertainty. Last but not least, the exact values of the viewing angle, speed, particle energies, contents of the jet, and particle acceleration mechanisms during the IceCube-211208A event have not been well studied so far (for more details, we refer to the discussions in Sahakyan et al. 2023; Acharyya et al. 2023).
In order to help resolve these ambiguities, we analyzed time-series radio very-long-baseline interferometry (VLBI) data of PKS 0735+178 obtained during 2020–2024, including the time of IceCube-211208A. Radio VLBI observations have a superb angular resolution, which made their roles in identifying γ-ray emitting regions in jets of AGNs and tracing their flux and structural time evolution unique (see, e.g., Kim et al. 2018a, 2020, 2023; Paraschos et al. 2023; Jeong et al. 2023; Traianou et al. 2024). High-resolution VLBI imaging can also resolve unique fine-scale structures of the jets, such as the large opening angle, edge brightening, and jet curvatures (e.g., Pushkarev et al. 2009; Ros et al. 2020; Kim et al. 2020), which may generate high-energy γ-ray emission as well as neutrinos (see also Ros et al. 2020; Britzen et al. 2021).
In light of these advantages, we determined the exact location of the neutrino emission that might be related to IceCube-211208A in PKS 0735+178 and constrained the structural, dynamical, and emission properties of the neutrino-emitting plasma blob. We also investigated the evolution of the multiwavelength light curves of PKS 0735+178 in search of their possible temporal correlation with the structural evolution of the VLBI-scale jet and neutrinos on longer timescales than previously reported.
This paper is organized as follows. In Sect. 2 we describe the multimessenger and radio VLBI data we used. In Sect. 3 we present our analysis and focus on the VLBI data in particular. The main results from our work are shown in Sect. 4. We then discuss the physical implications of our findings in Sect. 5 and provide conclusions in Sect. 6.
Throughout this paper, we adopt a redshift z = 0.42 from Nilsson et al. (2012), but other estimates of z as large as z∼0.65 were also reported (Falomo et al. 2021). We also assume a cosmology with H0 = 67.8 km s−1 Mpc−1, Ωm = 0.31, and ΩΛ = 0.69 (Planck Collaboration XVI 2014), which yields a 5.53 pc/mas conversion scaling factor at the redshift of PKS 0735+178.
2. Multimessenger data of PKS 0735+178
2.1. Neutrinos from various neutrino observatories
The IceCube observatory issued an initial alert, IceCube-211208A, of 172 TeV energy on 2021 Dec. 08 at UT 20:02:51.1 or MJD 59556.84 (IceCube Collaboration 2021), whose 90% positional error region (statistically) marginally contained PKS 0735+178. Afterward, multiple neutrino observatories reported additional detections of ∼GeV-TeV neutrinos after IceCube-211208A on delay timescales of a few hours to some days (Dzhilkibaev & Suvorova 2021; Petkov et al. 2021; Filippini et al. 2022). We specifically focus on IceCube-211208A and its arrival timing as a representative of all the neutrino events because all these events occurred within a timescale of a week. Our main interest, however, is to discover the weekly to monthly evolution of the typically more slowly variable compact radio jet. We refer to the literature (e.g., Sahakyan et al. 2023; Acharyya et al. 2023; Prince et al. 2024) for more details of the various lower-energy neutrino detections related to IceCube-211208A and PKS 0735+178.
2.2. γ-rays from Fermi/LAT
We made use of γ-ray data of PKS 0735+178 that are available from the Fermi-LAT Lightcurve Repository (LCR1; Abdollahi et al. 2023). We extracted weekly averaged 0.1−100 GeV band γ-ray photon counts (in units of ph cm−2 s−1) from the direction of the source 4FGL J0738.1+1742 (Abdollahi et al. 2020) located at RA = 114.539° and Dec = 17.707° from the repository. We used a minimum detection significance of TS = 4 and a fixed γ-ray photon index. The entire Fermi-LAT light curve of PKS 0735+178 spans a time range of ∼2009−2024. The minimum, maximum, and median time cadences of the observation are ∼6, ∼28, and ∼7 days, respectively.
2.3. X-rays
We obtained 0.3−10.0 keV and 1.0−4.5 keV X-ray count rates in units of counts s−1, measured by the Neil Gehrels Swift Observatory (Gehrels et al. 2004) around the timing of IceCube-211208A. These data were partly taken from Table 1 of Sahakyan et al. (2023) (see references therein for the details of the data acquisition and processing).
We also obtained additional 0.3−10.0 keV X-ray count rates, also in counts s−1, from the Swift X-Ray Telescope Monitoring of Fermi-LAT Gamma-Ray Sources of Interest program2 (Stroh & Falcone 2013). The minimum, maximum, and median cadences of the observations are ∼0.075 ∼3385, and ∼7.23 days, respectively.
2.4. Optical
The flux densities of PKS 0735+178 at the optical g and V bands were obtained from the publicly available database from the All-sky Automated Survey for Supernovae (ASAS-SN) program3 (Shappee et al. 2014; Kochanek et al. 2017). The optical flux measurements of PKS 0735+178 span MJD 55959-58452 (2012-02-01 to 2024-05-29), with minimum, maximum, and median cadences of ∼0.8, ∼340, and ∼3 days.
2.5. Radio VLBI
We obtained publicly available radio VLBI data of PKS 0735+178 from the programs Monitoring Of Jets in Active Galactic Nuclei with VLBA Experiments (MOJAVE4; Lister et al. 2018) and the Blazars Entering the Astrophysical Multi-Messenger Era (BEAM-ME5; Jorstad & Marscher 2016; Jorstad et al. 2017; Weaver et al. 2022).
They both provide fully calibrated VLBI data (visibilities and images) from the Very Long Baseline Array (VLBA) observations at 15 and 43 GHz
We obtained the FITS map data of PKS 0735+178 at 15 and 43 GHz from the above databases for the images and used the attached clean component (CC) table to extract the flux densities of the extended jet and the compact nuclear regions.
We note that these CLEAN images were produced without strong prior conditions on the source size, and they account well for the total flux densities in the milliarcsecond-scale jet constrained by the visibility amplitudes of the shortest baselines (Lister et al. 2018; Jorstad et al. 2017).
We mainly used the calibrated UVFITS data at 43 GHz for the visibilities and did not include the 15 GHz observations to analyze the time evolution of the source at the highest possible resolution by the visibility model-fitting technique. The details of these analyses are described in Sect. 3.
To understand the long-term evolution of the jet until recent epochs in 2024, we collected the 43 GHz data from 2007 Jun 13 to 2024 Aug 31. Similarly, the 15 GHz image data were obtained for the period of 2007 Mar 02 to 2024 May 17.
3. Analysis of the VLBI data
3.1. Image analysis
First of all, we defined the nuclear region and extended jet and measured their flux densities as follows. At both frequencies, the nuclear region was defined as a circular region extending up to 0.4 mas in radius (i.e., a diameter of 0.8 mas) from the intensity peak in the image. The remaining extended jet was then defined as an extended region at distances of 0.4 to 1.0 mas from the intensity peak. We chose a radius of 0.4 mas for the nuclear region because this is comparable to half of the VLBA beam size at 15 GHz in the N-S direction. The 1.0 mas distance cutoff for the extended jet was furthermore chosen based on visual inspections of the images of the jet emission over >3σ image noises at 43 GHz and to avoid including noisy CLEAN components close to the noise level in the accurate flux calculation. For each region, we integrated the flux densities of the provided CLEAN components inside these areas and obtained representative flux densities at 15 and 43 GHz.
To verify whether the extended jet flux was strongly affected by the somewhat arbitrary choice of the distance cutoff at 1.0 mas, we also computed the total flux densities using a larger jet size of 2.0 mas. We found only an average increase in the total flux density of ∼50 mJy for all the epochs, which is a change of ≲5% in the brightness of the source after IceCube-211208A for the >1 Jy source flux. The 5% is also smaller than the ∼10% systematic flux uncertainties that we assumed in the later analysis. Thus, we consider that systematic uncertainties due to the cutoff in the jet size determination are negligible.
From these flux measurements, we also computed the 15–43 GHz spectral index of the nuclear region,  (Sν∝να, where Sν is the flux density, and ν is the observing frequency). Because VLBA 15 GHz data around MJD 56500–59500 are lacking, we computed values of α for two different periods: MJD 54000–56500 (well before IceCube-211208A), and MJD 59500–60000 (after IceCube-211208A). To align the timestamps of the 15 and 43 GHz data, we time-averaged the flux measurements with time bin sizes of 295 and 123 days for the earlier and later periods. These bin sizes represent the mean cadences of the VLBA 15 GHz observations in each period, which are more sparse in time than the 43 GHz observations. We then computed the spectral index as
  , where S15,43 GHz are the binned flux densities at 15 and 43 GHz. To estimate the uncertainties of
  , we assumed conservative systematic 10% flux uncertainties in S15,43 GHz following Lister et al. (2018), Jorstad et al. (2017), Weaver et al. (2022). The final uncertainties of α were then obtained by the error propagation.
We also note an additional source of systematic uncertainty in α. By setting the same peak-centered masks at both frequencies to compute the spectral indices at 15–43 GHz, we implicitly assumed that the effect of possible relative shifts between 15 and 43 GHz images is small. In contrast, the frequency-dependent shift of the peak positions in the VLBI images of AGN jets as a result of the opacity effect close to the base of the jet (i.e., the core shift; Lobanov 1998) might be non-negligible. This is expected for a conically expanding relativistic jet (Blandford & Königl 1979). To verify the presence and impact of the opacity effect in our calculations of the spectral indices, we estimated the relative offsets of the peak positions in the 15 and 43 GHz images for several representative epochs before and after the IceCube-211208A event, for which contemporaneous dual-frequency VLBI datasets of the source with a time difference of less than two weeks are available. To estimate the amount of image alignment for each pair of 15 and 43 GHz images, we modeled the visibilities of the 15 and 43 GHz datasets using the Modelfit task in the Difmap software (Shepherd 1997; see also Sect. 3.2 for more details) and cross-identified extended jet features in the two frequency datasets based on the jet morphologies. We then computed the spectral indices for each feature and used the centers of the most optically thin jet feature as the astrometric reference point. Confidence for the low opacity of these features was also obtained through their high fractional linear polarization of ≳10%. By aligning the dual-frequency images, we found maximum relative offsets of the peak positions of ≲0.15 mas in six epochs before and after the IceCube-211208A event. This is approximately ≲19% of the 0.8 mas diameter size, which is a small fraction. In order to quantify the impact of this small offset on the spectral indices of the nuclear region, we also added additional position shifts of 0.15 mas west of the centers of the 0.8 mas diameter circular masks at 15 GHz. We then repeated the same steps as above to compute revised spectral indices. By comparing the differences in the spectral indices with and without the shift of the 15 GHz mask center positions, we found the mean value of the residuals to be 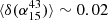 . This difference is significantly smaller than the typical uncertainties α we estimated, and it was added in quadrature to the total error budget on α.
3.2. Gaussian source modeling
In order to measure more detailed properties of the jet (e.g., the brightness temperature and the proper motions of the VLBI jet components), we primarily focused on the VLBA 43 GHz data because they were observed more regularly and also offered a higher angular resolution for tracking motions close to the VLBI core. The whole model-fitting analysis was conducted as follows. For each single epoch, we modeled the VLBA 43 GHz visibilities using multiple circular Gaussian components in the visibility domain, where each component was described by four parameters, namely the flux density, S, the distance from the core, r, the position angle, PA, and the full width at half maximum (FWHM), d. For the actual fitting, we used the Modelfit task implemented in the Difmap software (Shepherd 1997). We set the initial component model parameters by visual inspection of the dirty map and applied the Modelfit task iteratively until convergence was reached. We inspected the fit quality by computing the visibility-domain χ2 and by visually inspecting the fit quality in the visibility amplitudes and phases. We also searched for any significant residual flux higher than the 3σ level in the residual map. When significant additional emission was found in the inspection, additional Gaussian components were added and fit again, until no remaining flux at the >3σ level was found. Following previous studies using the VLBA 43 GHz data (e.g., Jorstad et al. 2017), we also fixed the minimum FWHM size of a component to be one-fifth of the geometric mean of the beam size when the Modelfit task numerically enforced unrealistically small model sizes.
To trace the time evolution of the individual jet components, we needed to label the fit VLBI components at various epochs with unique IDs. The entire epochs were model-fit following the steps outlined below in order to reduce possible systematics in the labeling. First, we manually model-fit the first few epochs in order to obtain a reliable description of the global core and jet structure. Then, we transferred the converged Gaussian components of a previous epoch to the next as a new starting model for the iterative Modelfit task. By doing so, the total number of components was kept the same in adjacent epochs, and the Modelfit task essentially fit the time changes in the model parameters. This approach can reduce potential systematic uncertainties that might arise from changes in the (u,v)-coverages and sensitivities from one epoch to the next, and it also enables a more robust cross-identification of VLBI components at different epochs (see also other studies, e.g., Jorstad et al. 2017). We note that for a sudden and substantial structural change in the source in certain epochs, for instance, when a new VLBI component appears from the VLBI core, additional Gaussian components should be incorporated in the model fitting. These features were typically bright and showed up clearly in the above inspection procedures. We also note that especially when the (u,v)-coverage was quite limited, we were forced to place additional Gaussian components, even if they did not have associated components in the previous epochs. In these cases, we simply kept them in the corresponding epochs, but did not provide IDs for them for the subsequent physical interpretations. When they did not appear to be of high significance in the following epochs, we also removed them manually in the subsequent observations in order to maintain the total number of models as consistent as possible throughout the whole period. After the last epoch was successfully fit, we grouped and labeled the VLBI components based on the smoothness of the time evolution of their positions, sizes, and fluxes in adjacent epochs. While we did this, we defined the VLBI core as the reference point of the kinematic analysis. We note that there are various possible definitions of the VLBI core, for instance, based on the jet morphology, brightness temperature, optically thick spectrum, and time variability of the flux density (see, e.g., discussions in Hodgson et al. 2017). Since we only used single-frequency 43 GHz data for the kinematic analysis, we chose the most upstream visible feature located at the west end of the jet with the highest brightness temperature as the core. We note that this feature shows the highest brightness temperature in all epochs we analyzed, which is consistent with the properties of the VLBI core expected in the basic model of a conically expanding relativistic jet (Blandford & Königl 1979). We did not detect any significant emission west of the above-defined VLBI core in the analyzed epochs either.
Overall, we found that three to five circular Gaussian components were sufficient to describe the jet morphology in all epochs and to cross-identify individual VLBI components, especially after 2022 Apr 30, when the data were stably modeled with only three Gaussians. The image root-mean-square (RMS) noise levels of the dirty maps after modeling were also comparable to those of the CLEAN images.
We note that significant time-changing opacity in the base of the jet might also cause non-negligible drifts in the absolute position of the VLBI core (e.g., Plavin et al. 2019), however, especially during broadband electromagnetic flares in the source (e.g., Niinuma et al. 2015). This would lead to additional errors in the kinematics analysis of the downstream jet components. Since the VLBA 43 GHz data we used lack phase-referencing calibrations for astrometric image registrations (Jorstad et al. 2017), we followed an alternative method that inversely used jet components that traveled downstream as probes of the relative motion in the VLBI core over time. That is, we computed residuals of the motions of the VLBI components from their linear fit models (see Lisakov et al. 2017). This calculation can identify, if present, significant motions in the chosen reference point by correlated group deviations of the residual motions (see also Kim et al. 2020 for additional examples). To this end, we performed this analysis for the two components identified at 43 GHz after IceCube-211208A (C1 and C2; see Sect. 4) and focused on epochs in which the two components fit their linear models well. The calculations of the motion residuals were then performed for the radial distance and RA/Dec positions. In all cases, we found residual displacements of ≲0.03 mas of the jet component positions from their linear kinematic models overall, with Pearson correlation coefficients of <0.2 for the residuals of C1 and C2. This indicates no statistically significant jitter in the core position over time at levels greater than ∼0.03 mas. This value is far lower than the beam size of the VLBA observations at 43 GHz. For epochs after MJD 60000, where C2 alone decelerated significantly and therefore could not be analyzed in the above way, C1 still showed good linear fits. This suggests that the intrinsic motions of these two components are much larger than potential drifts of the VLBI core. Considering the above effects, we conclude that the proper motion of the VLBI core itself is not significant in the following analysis.
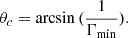
After we fit the model and assigned the component ID, we determined the uncertainties of the model components as follows. Following Casadio et al. (2015), Jorstad et al. (2017), we assumed that components with smaller sizes and higher flux densities have smaller statistical errors in the model parameters, namely Sν, r, PA, and d. We therefore first computed the observed brightness temperature TB of each component as
 (1)
(1)
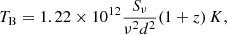
(Kim et al. 2018b) where Sν is the flux density in Jy, ν is the observing frequency in GHz, d is the FWHM size in mas, and z = 0.42 is the redshift of PKS 0735+178. The statistical uncertainties of the other parameters were then computed with the following empirical relations (Casadio et al. 2015; Jorstad et al. 2017):
 (2)
(2)
(Casadio et al. 2015; Jorstad et al. 2017; Weaver et al. 2022) where σX,Y are the RA/Dec position errors in mas, σS is the flux density uncertainty in Jy, and σd is the FWHM error in mas. We note that we used a factor of 2 in σY to account for the about twice larger beam size in the N–S direction. The uncertainties in r and PA – σr and σPA were obtained by propagating these uncertainties. Next, we added systematic errors of 10% for the flux density and 5% for the sizes in quadrature to the above statistical errors in order to obtain the total error budget. Because we adopted TB as the primary observable in Eq. (2), we only assumed systematic uncertainties in S and d to estimate the representative uncertainties of TB.
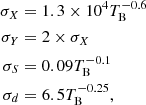
To measure the proper motions and kinematics of each VLBI component, we modeled the radial distances of each unique component from the core as a function of time as
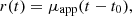 (3)
(3)
where 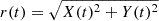 is the radial distance of a component from the core, t is the observing epoch in years, and μapp is the apparent proper motions in mas/yr, t0 is the time in years of the ejection of a VLBI component from the VLBI core. Using r(t) and t, we determined μapp and t0 by linear regression using the curve_fit package in Scipy (Virtanen et al. 2020). The apparent jet speed in units of speed of light c, βapp, was computed by
 (4)
(4)
where DL = 2371 Mpc is the luminosity distance to PKS 0735+178, and c is the speed of light.
4. Results
We show in Fig. 1 the VLBI jet images of PKS 0735+178 at 15 and 43 GHz close in time to the IceCube-211208A event. The source clearly shows a compact VLBI core that dominates the overall flux and north-east oriented jet, which is similar to the general morphology of the source between 2007–2018 (Jorstad et al. 2017; Weaver et al. 2022). The peak flux densities at 15 and 43 GHz are significantly higher than the historical average values by factors of a few, however (see Jorstad et al. 2017; Lister et al. 2019 and also Plavin et al. 2023). A summary of the properties of the CLEAN images for all epochs is given in Table A.1.
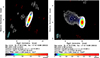 |
Fig. 1. VLBI images of PKS 0735+178 on 10 December 2021 (left) and 14 December 2021 (right) at 43 (left) and 15 GHz (right). |
The multiwavelength light curves of the source are shown in Fig. 2, and a zoomed version after the IceCube-211208A event is shown in Fig. 3. Two main features are noteworthy in the light curves: As other studies reported (e.g., Plavin et al. 2023; Prince et al. 2024; Bharathan et al. 2024), the source shows pronounced and nearly contemporaneous γ-ray, X-ray, and optical flares around the time of the IceCube-211208A event. The maxima of the VLBI radio flux densities at 15 and 43 GHz occur with delay timescales of ∼180 and ∼140 days, respectively, after IceCube-211208A, however. We note that an increased radio flux density is frequently seen in neutrino candidate AGNs close to other IceCube neutrino events (e.g., Plavin et al. 2023). Another important point is that PKS 0735+178 still continues to be variable in γ-ray after ∼MJD 59800. It might indicate a complex temporal correlation between neutrino and electromagnetic flares within the field of IceCube-211208A due to a number of sources within the field and to the poor angular resolutions of some of the involved observatories, including the IceCube observatory itself (see, e.g., Garrappa et al. 2019 for the case of TXS 0506+056), or to a source-intrinsic post-neutrino evolution of the blazar PKS 0735+178 itself (e.g., Cerruti et al. 2019).
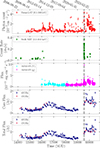 |
Fig. 2. Multiwavelength light curves of PKS 0735+178. From top to bottom: 0.1–100 GeV γ-ray photon flux from Fermi-LAT, 0.3–10 keV photon count from Swift/XRT, optical g- and V-band flux densities from ASAS-SN, 15 and 43 GHz flux densities of the VLBI nuclear region from the VLBA (MOJAVE and BEAM-ME; see the text for the definition of the core), and the same, but for the entire compact jet. The vertical dashed gray lines mark the time of the IceCube-211208A event. |
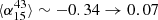
Figure 4 shows the time evolution of the spectral index of the VLBI nuclear region in a window of 15–43 GHz,  , computed from the CLEAN images. While the VLBI core displayed relatively steep spectral indices before the IceCube-211208A event (the mean and standard deviation of the spectral indices is
 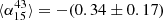 ), the values of
  changed substantially after the neutrino event and reached
 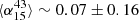 . This most likely indicates a significant change in the synchrotron opacity of the nuclear region.
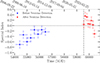 |
Fig. 4. Spectral indices of the nuclear region at 15–43 GHz. The vertical dashed line indicates the timing of IceCube-211208A, and the blue and red data points show the spectral indices before and after the neutrino events. The horizontal error bars represent timescales for the binning at 15 and 43 GHz. |
Below, we present the results based on the visibility model-fitting of the VLBA 43 GHz data. Details of the model components, including their IDs, fluxes, positions, and sizes for all the observed epochs, are shown in Fig. A.1 and Table A.2. Despite varying (u,v) coverages and signal-to-noise ratios from one epoch to the next, we were able to identify with the procedures in Sect. 3.2 five major components labeled C0 to C4, with C0 corresponding to the VLBI core and taken as reference for the kinematic analysis. The proper motions for C1 to C4 over time in RA/Dec, the radial core separation, and the position angle are shown in Figs. 5, 6, and 7, respectively. The angular and apparent speeds of the components estimated by Eqs. (3) and (4) are summarized in Table 2.
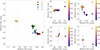 |
Fig. 5. Positions of model-fit components from the analysis of the VLBA 43 GHz data of PKS 0735+178 during ∼2020−2024. Large left panel: Positions of all the components. Small right panels: Detailed time evolution of the position for the individual components. In all panels, the empty black circle represents the location of the VLBI core (C0). |
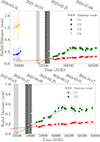 |
Fig. 6. Radial distances r(t) of the moving components C1 to C4. The top panel shows the distances for all the components. The bottom panel shows the same information, but zoomed in smaller regions of time and radial distances to highlight C1 and C2. The empty circles represent model-fit but not uniquely identified components in both panels (see Sect. 3.2). The dashed green and red lines display linear models of r(t) fit to the data of C1 and C2, respectively. The light and dark gray regions indicate the timing of the ejection of C2 from the VLBI core (C0), MJD 59384.1±34.5, and the passage of C1 through C2, MJD 59575.53±50.41. The vertical dashed dark line corresponds to the timing of IceCube-211208A. |
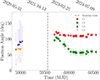 |
Fig. 7. Position angles of C1 to C4 over time. The vertical dashed line corresponds to the timing of IceCube-211208A. |
Spectral indices of the nuclear region at 15–43 GHz.
Kinematics of the Gaussian model components.
The motion speeds of C3 and C4 are consistent with zero within the uncertainties. This is most probably due to the small number of epochs that we analyzed to trace their motions. On the other hand, the kinematics of C1 and C2 show several interesting features that we report in detail below. Component C1 moves at a significantly slower subluminal speed (∼0.042±0.002 mas/yr, or ∼0.77±0.039c), than the fastest and median superluminal jet speeds reported for PKS 0735+178 (0.257 and 0.167 mas/yr at 15 GHz, i.e., ∼4.8c and 3.1c, respectively (Lister et al. 2019); and 0.242 and 0.191 mas/yr at 43 GHz, i.e., ∼4.5c and ∼3.6c, respectively (Weaver et al. 2022)). Instead, the relatively slow speed of C1 is comparable to the speeds of the slow features reported by Agudo et al. (2006) for the inner ≲1 mas jet of PKS 0735+178 during 1996 March to 2000 May (0.023−0.024 mas/yr) when PKS 0735+178 was in a quiescent state. We also note that Weaver et al. (2022) reported two stationary features at ∼0.13 mas and ∼0.31 mas downstream of the VLBI core at 43 GHz during 2007 June to 2018 December (designated A2 and A1 in their study, respectively). While some stationary jet features around the times of significant electromagnetic flares show outward motions and then returned to their original position (e.g., Jorstad et al. 2017; Weaver et al. 2022), the observed proper motion of component C1 after 2021 does not match this behavior, that is, it only shows a monotonic outward motion. We therefore assumed that these stationary components A1 and A2 in Weaver et al. (2022) were present before the IceCube-211208A event, but disappeared in later epochs. We note that these stationary components appeared and disappeared on timescales of a decade in jets of various AGNs (Weaver et al. 2022). We cannot exclude other possibilities, however, such as that C1 is a stationary feature that was displaced from its previous position, and that it might return to its original position after a longer time. We discuss these interpretations in Sect. 5 in more detail.
Component C2 travels to the jet downstream at a significantly faster speed than C1 (∼0.25±0.02 mas/yr or ∼4.7±0.4c). This speed is close to the aforementioned maximum speeds reported for the jet in PKS 0735+178. By back-extrapolating the kinematics of C2, we found that the component newly appeared from the core at the ejection time of t0=MJD 59384.1±34.5, which is earlier than the timing of IceCube-211208A (MJD 59556.84) by 172.7±34.5 days. The statistical difference is nearly 5σ. Furthermore, the position angle of C2 changed substantially over time, from ∼105° to ∼50° from the first epoch when the component was resolved and until ∼MJD 60 096 after which C2 became nearly stationary with respect to C0 (see also Fig. 5). While PKS 0735+178 previously displayed modulations in the jet position angle over time (e.g., Gómez et al. 2001a; Agudo et al. 2006; Lister et al. 2021; Jorstad et al. 2017; Weaver et al. 2022), no large PA change within less than two years was observed in PKS 0735+178. A large drift of the PA is also uncommon in the parsec-scale jets of AGNs in general (see Lister et al. 2021). The apparent motion of C2 also significantly decelerated after ∼MJD 60000 and then nearly ceased moving outward, when the component reached a core separation of ∼0.5 mas (∼2.8 pc projected). Although jet components close to the VLBI core or other nearby bright features might exhibit apparently nonradial, stationary, or inward-moving kinematics due to blending of the emitting features (e.g., Fromm et al. 2013; Lister et al. 2021), we note that C2 is relatively well separated from C1 and C0 at the later time. The observed apparent deceleration is therefore not an imaging or modeling artifact. These nonballistic motions are commonly observed in jets of AGNs with particularly small viewing angles (see, e.g., component B3 in CTA 102 and B12 in 3C 454.3 in Weaver et al. 2022, and component 19 in OJ 287 in Lister et al. 2021). These components could show apparently stationary kinematics on timescales of a few years even when they previously displayed constant radial outward motions. Although the physical reasons for these motions could be various, such as jet bending due to an interaction of the jet with the interstellar medium (ISM) or internal helical motions in the jet (see, e.g., Traianou et al. 2024 for a brief review), continued monitoring of these peculiar features also often revealed continued radial outward motions on longer timescales. We therefore do not discuss these scenarios for C2 in greater detail because continued monitoring of the component may reveal its origin better.
Last and most strikingly, the trajectories of C1 and C2 shown in Fig. 5 obtained from the linear motion fit and from the formal analysis of the core separation r(t) of C2 strongly suggest an apparent passage of C2 through C1 at MJD 59575.53±50.41 at a core separation distance of 0.13±0.015 mas. This is a difference of 18.69±50.41 days compared to the time of IceCube-211208A (MJD 59556.84) and suggests a strong temporal correlation between this apparent passage and the IceCube-211208A event. The corresponding region is a possible spatial origin of IceCube-211208A within the compact jet of the blazar PKS 0735+178.
In Fig. 8 we show the time evolution of the flux densities, FWHM sizes, and brightness temperatures TB of C0 to C4. At the time of the IceCube-211208A event (MJD 59556.84), the C0 flux densities were higher by factors of ∼2−3 than in the latest quiescent period at ∼MJD 59,000, and the flux increased even more later on. The value of TB did not change significantly at this time, however. TB of C0 instead significantly increased later by factors of about times 10, and the maximum appeared around ∼MJD 59750, which is ∼200 days after the IceCube-211208A event. After this time, C1 became brighter than C0 and dominated the VLBI-scale flux density of the jet in PKS 0735+178. Interestingly, the flux density of C2 began to rise significantly after ∼MJD 60096, which was coincident with the deceleration and position angle change in the component. This might indicate a certain physical evolution of the component, such as an interaction with the ISM or jet bending toward the line of sight and an increased Doppler-beaming effect.
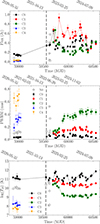 |
Fig. 8. Flux densities (top), FWHM sizes (middle), and brightness temperatures (bottom) of the model-fit components C0 to C4. In all panels, the vertical dashed lines indicate the timing of IceCube-211208A. |
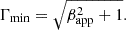
We also measured the variation in TB versus the radial core distances for C1 and C2, which can be a useful diagnostics of various evolutionary stages of traveling jet components, namely Compton, synchrotron, and adiabatic energy loss (see Marscher et al. 1992; Fromm et al. 2011; Schinzel et al. 2012). Specifically, we fit a model of
 (5)
(5)
(Schinzel et al. 2012) where r is the core separation in milliarcseconds, and ϵ is a free parameter to be fit. The results are shown in Fig. 9. The values of ϵ are 2.37±0.53 and 3.45±0.38 for C1 and C2, respectively. For both components, the derived values of ϵ lie closely to ϵC = 1.25 and ϵa = 3.17, which are expected values from the Compton-dominated or adiabatic energy losses in a jet dominated by the transverse magnetic field, a typical synchrotron spectral index of α=−0.5, and a constant Doppler factor, in contrast to ϵS = 4.17, which is expected for a pure synchrotron energy-loss case for the same jet (Schinzel et al. 2012).
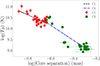 |
Fig. 9. Log brightness temperatures vs. radial distances of the jet features C1 and C2 after the IceCube-211208A event. The slopes of the fit lines are −(2.37±0.53) and −(3.45±0.38) for C1 and C2, respectively. |
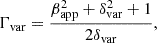
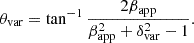
Last, we computed the jet Lorentz factor Γ, Doppler factor δ, viewing angle θ, and their limiting values using the apparent jet speeds and time evolution of the flux densities for individual components. First of all, the minimum bulk Lorentz factor, Γmin, can be computed straightforwardly as follows:
 (6)
(6)
(Boettcher et al. 2012; Paraschos et al. 2023). We find Γmin = 1.27±0.02 and 4.82±0.42 for C1 and C2, respectively. Then, the corresponding minimum critical viewing angles are
 (7)
(7)
(Boettcher et al. 2012). For C2, which shows higher Γmin, we find θc∼(11.9±1.06)°. This value is comparable to the results of Agudo et al. (2006), who derived θ≤9° for the period 1996–2000. We note that Weaver et al. (2022) obtained θ∼1.09°−3.36° for the two most reliable jet features in their analysis of the VLBA 43 GHz data of PKS 0735+178 during 2007–2018.
In order to estimate the Doppler factors without information about the counter-jet emission, we made use of the time variability of C2. More specifically, we computed the variability Doppler factor, the variability Lorentz factor, and the corresponding viewing angle. Following Jorstad et al. (2017), Weaver et al. (2022), the variability Doppler factor can be expressed as
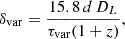 (8)
(8)
where d is the angular size of the component in milliarcseconds (i.e., the FWHM size of Gaussian component), DL is the luminosity distance in Gpc, τvar=dt/ln(Smax/Smin) is the Doppler-boosting-corrected variability timescale of the superluminal jet feature in years, and dt is the timescale in years that passed between the maximum and minimum flux densities Smax and Smin. Further following Jorstad et al. (2017), we estimated τvar by fitting a model of the flux variation ln(S(t)/S0) = k(t−tmax) to the data, where S(t) is the flux density as a function of time t, tmax>t is the epoch when Smax occurs, and S0 and k are free parameters to be determined by a least-square fitting of the model to the data. When k is determined, it follows that τvar=|1/k|. By following the above procedures to the data of C2, which shows a clear decay of flux (see the top panel of Fig. 8), we find k=−(1.11±0.17) (see Fig. 10), and accordingly, τvar∼0.90±0.14 yr. We note that Eq. 8 is meaningful only when τvar is shorter than that of the light-crossing time of the emitting component. For a mean FWHM size of 0.26 mas of C2 during which the flux of C2 gradually decreased, the light-crossing time at the distance of PKS 0735+178 is ∼4.7 years. This is a significantly longer time than τvar.
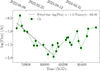 |
Fig. 10. Flux density evolution of the component C2 vs. time. A linear model fit to the data is shown as a solid black line. |
Plugging into Eq. (8) a mean and standard deviation of the angular size of C2 〈d〉 = 0.26±0.10 mas during the period when C2 displayed a constant radial speed (Fig. 6), DL = 2.36 Gpc, and z = 0.42, we obtain δvar = 7.59±3.15. This value broadly agrees with the lower limit obtained by the MOJAVE VLBA 15 GHz observations (δ>4.8; Homan et al. 2021) and also with δvar = 12.2±3.3 derived by Weaver et al. (2022) at 43 GHz using the VLBA. We note, however, that δ∼7−8 is still significantly smaller than the δ∼30 that was adopted in the literature for modeling the emission of photons and neutrino in PKS 0735+178 for IceCube-211208A (see, e.g., Sahakyan et al. 2023; Prince et al. 2024).
We then computed the variability Lorentz factor, Γvar, and the variability viewing angle, θvar. Following Jorstad et al. (2017),
 (9)
(9)
 (10)
(10)
Using the above δvar and βapp = 4.72±0.43 of C2, we find Γvar = 5.33±0.97 and θvar = 6.83°±4.11°. These values agree with Γmin∼4.8 and θc∼12° obtained by Eqs. (6) and (7). The value of θvar is also consistent within the uncertainties with θ = 3.4°±1.6°, which was estimated by Weaver et al. (2022) for the B3 component in their study, although another smaller angle of θ = 1.1°±0.3° was also estimated for the other traveling component B4.
5. Discussions
5.1. Dynamical nature of C1 and C2
Although we find a statistical connection between the apparent passage of C2 through C1 with the IceCube-211208A event, the dynamical nature of C1 and C2 needs to be characterized in order to understand the particle acceleration processes of the IceCube-211208A event itself and the contemporaneous multiwavelength flares. The C2 component exhibits a highly superluminal speed (βapp∼4.7, Γvar∼5.3), which is near its historical maximum. Since patterns such as instabilities propagate more slowly than plasma motions (Hardee 2000; Perucho et al. 2004), this Γ in principle can be a lower limit to the true jet speed. Alternatively, the high superluminal speed can also represent a traveling shock that is created by a strong pressure perturbation at the jet base and propagates downstream at a faster speed than that of the bulk jet plasma. Nevertheless, statistical studies show that the fastest apparent motions of AGN jets correlate with the apparent radio luminosities, and thus represent the true plasma speeds well (Lister et al. 2009). Based on these considerations, we expect that the historically high βapp of C2 reflects the true speed of the jet to some extent. Conversely, the slow βapp∼0.77c of C1 is well below the historic median jet speeds (3.1−3.6c at 15–43 GHz; Sect. 4), which indicates that the feature likely corresponds to patterns such as slowly traveling shocks (Marscher & Gear 1985; Daly & Marscher 1988; Gómez et al. 1997), Kelvin–Helmholtz pinch-mode instabilities (e.g., trailing shocks; Mertens et al. 2016; Fuentes et al. 2023; Gómez et al. 2001b; Agudo et al. 2001; Kadler et al. 2008; Beuchert et al. 2018), or standing recollimation shocks in temporarily oscillating motions (Fromm et al. 2013; Cohen et al. 2014; Jorstad et al. 2017; Plavin et al. 2019; Weaver et al. 2022).
We examined each of the above scenarios in detail and show that a single scenario is unlikely to fully explain the emission and kinematic properties of C1. (1) A moving shock originating from the core: By back-extrapolating the linear fit to the radial separations of C1 versus time to close to the ejection epoch from C0 (Fig. 6), we found no corresponding emitting feature at the predicted core distance, except for an unlabeled component at ∼0.3 mas. This suggests that C1 did not originate from the core and is no traveling shock from the jet base. (2) A trailing shock formed by C2: Simulations and observations of a propagating strong pressure perturbation (e.g., a strong superluminal component) show the formation of a series of slowly moving, trailing shocks behind (e.g., Gómez et al. 2001b; Kadler et al. 2008; Jorstad & Marscher 2016; Beuchert et al. 2018). This can in principle explain the kinematics of C1. The simulations also predict the trailing shocks to remain fainter than the core or major traveling component (Agudo et al. 2001; Gómez et al. 2001b; Kadler et al. 2008; Beuchert et al. 2018), however, which leaves the high flux of C1 unexplained. (3) A temporarily displaced standing shock structure: The flux density of C1 remains higher than that of C0 for most of the epochs we studied (Fig. 8). A high ratio like this is rare for moving components at 43 GHz (Weaver et al. 2022), but resembles those of quasi-stationary features during major radio flares in other AGN jets (Hodgson et al. 2017; Lisakov et al. 2017) as well as in PKS 0735+178 itself in the earlier epochs (the A2 component; see Jorstad et al. 2017; Weaver et al. 2022 and Fig. 11). It also agrees with the generation of stronger radio flares involving recollimation shocks (e.g., Fromm et al. 2016). The trajectory of C1 also indicates an inward motion close to the last epochs we analyzed (see C1 in Fig. 5), which means that C1 might be considered a standing shock that is displaced from its previous position (e.g., A2). We found no statistically significant deviation of the motions of C1 from the linear outward fit (Fig. 6), however, and thus, a longer monitoring is required to confirm or falsify this hypothesis.
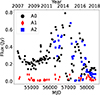 |
Fig. 11. Flux densities of the VLBI core (A0) and stationary components (A1 and A2) downstream of the jet in PKS 0735+178 that were identified before 2018, as reported by Weaver et al. (2022). |
We note that this complexity is expected because the jet in PKS 0735+178 has significantly changed in its emissivity and dynamics compared to the past quiescent periods (see Gabuzda et al. 1994; Gómez et al. 2001a; Agudo et al. 2001; Jorstad & Marscher 2016; Weaver et al. 2022). PKS 0735+178 has undergone a major outburst close to the time of IceCube-211208A and reached its brightest state at all wavelengths since ∼2006 (Fig. 2). Modeling the broadband SED close to the time of IceCube-211208A requires an exceptionally strong jet power in excess of the Eddington limit (e.g., Prince et al. 2024). Furthermore, we did not detect the previously known two quasi-stationary features A1 and A2, which can be direct evidence for a significant change in the jet structure. Observationally, their nondetection might also be explained by the limited dynamic ranges of recent VLBA 43 GHz observations since 2020, because A1 and A2 became considerably faint until ∼2018 and reached flux densities of ≲100 mJy (Fig. 11), while C1 is clearly much brighter (Fig. 8). This also implies, however, that the stationary features A1 and A2 are still significantly fainter than C1 and C2 in our study. We therefore still conclude that a significant change in the jet emissivity related to the variations in either the jet mass, magnetic field, or particle energy occurred.
A continued monitoring of the source at comparable or higher resolution and a follow-up analysis of the linear polarimetric properties of C1 and C2, such as their degree of linear polarization and the electric vector position angle, will therefore allow us to better understand their nature through a modeling of the quantitative particle acceleration (e.g., Cawthorne 2006; Marscher 2014; Beuchert et al. 2018; Kim et al. 2019).
5.2. Implications for the external inverse-Compton models
The source of external background photon fields around the apparent C1-C2 overlap region is also important not only for the production of high-energy neutrinos via proton-photon interactions (see, e.g., Padovani et al. 2019), but also for the contemporaneous gamma-to-optical flares in the source (e.g., Sahakyan et al. 2023; Acharyya et al. 2023; Prince et al. 2024). We primarily considered the external inverse-Compton model for a lepto-hadronic jet because the synchrotron self-Compton models employed in previous works to explain the IceCube-211208A event in association with PKS 0735+178 (Sahakyan et al. 2023; Acharyya et al. 2023; Prince et al. 2024) encountered various problems.
In the external inverse-Compton models, the distance between the central engine and the site of high-energy photons and neutrinos is a crucial parameter. We estimated the distance between the apparent C1–C2 overlap region and possible sources of external radiation fields as follows. On 2021 Dec 08 (i.e., the time of IceCube-211208A), component C1 was estimated to be ∼0.13±0.01 mas away from the VLBI core (C0), according to the linear motion fit (Fig. 6). Based on the 5.53 pc/mas scaling factor at the distance of PKS 0735+178 and θ = 6.83°±4.11°, the deprojected distance between the core and C1 is ∼6.05±3.65 pc. The central engine can be located farther upstream of the 43 GHz VLBI core because of the core-shift effect (see also Sect. 2.5), given the significant 15-43 GHz nuclear opacity in the inner region of 0.4 mas in the jet in PKS 0735+178 after the detection of IceCube-211208A. The above ∼6.05±3.65 pc distance therefor is a lower limit.
We note that this distance is significantly longer than that of the broad line region (BLR) from the central engine of PKS 0735+178, RBLR = 0.79×1017 cm ∼0.026 pc (e.g., Prince et al. 2024) by a factor of at least ∼230, which means that the BLR is probably not the primary source of external UV photon fields. The dusty molecular torus around the central SMBH might be another source of seed photons, which could typically extend up to several hundred parsecs (see, e.g., Jaffe et al. 2004; Carilli et al. 2019). The AGN torii will mainly provide infrared photons, however, whose maximum dust sublimation temperatures of ∼1000−2000 K occur near the central BH (e.g., Kishimoto et al. 2007), while the radiation field at UV energies is considered to be necessary to explain high-energy flares in PKS 0735+178 especially at γ-ray energies (Sahakyan et al. 2023; Acharyya et al. 2023; Prince et al. 2024).
Therefore, additional sources of external background radiation field should be considered. Alternatively, models that are less sensitive to the radiative environment would be more appropriate for IceCube-211208A. One such models is the spine-sheath scenario, in which a slow sheath layer surrounds the central relativistic spine of a two-flow jet (e.g., Ghisellini et al. 2005). In particular, the relative velocity difference between the two flows can greatly amplify the photon field around the central spine, leading to productions of >100 TeV neutrinos, if the central spine carries abundant high-energy cosmic rays (Tavecchio et al. 2014; Tavecchio & Ghisellini 2015). Although detailed calculations of the broadband SEDs are beyond the scope of our work, we briefly comment on two other neutrino AGNs for which the spine-sheath model also showed some relevance, and we suggest that additional studies are worth consideration. For instance, Ros et al. (2020) found a newly developed edge-brightened structure in the inner jet of the neutrino blazar TXS 0506+056 after the IceCube-170922A event. Furthermore, Britzen et al. (2021) reported a peculiar arc-like sheath in PKS 1502+106 close to the time of an IceCube neutrino event that might provide the necessary seed photons for a passing jet component for the inverse-Compton processes to occur. To investigate the relevance of the spine-sheath scenario for PKS 0735+178, a higher-resolution imaging of PKS 0735+178 in search of limb-brightened jet structure would be important.
5.3. The Doppler factor crisis in PKS 0735+178
Last, we discuss the large discrepancy in the Doppler factors in PKS 0735+178 as constrained by our radio VLBI data analysis (i.e., δvar∼7.6±3.2 in C2, which likely represents the underlying jet flow; see Sect. 5.1) and a higher value of δ∼30 that has widely been adopted for the emission modeling in the literature. This discrepancy is well known as the Doppler crisis (see, e.g., references in Ros et al. 2020), and was also noted in earlier studies of PKS 0735+178 concerning IceCube-211208A (see, e.g., Sahakyan et al. 2023).
In addition to the aforementioned spine-sheath model, another scenario that might reconcile the discrepancy is the bending of the jet and its deceleration after the apparent C1–C2 overlap region. This is motivated by the fact that C2 displays a large change in the apparent position angle over time by ∼90° (Fig. 7). One possible way to change the apparent jet position angles is to vary the intrinsic jet viewing angle along the jet propagation. This in turn might introduce large changes in the jet Doppler factor during a short period of time, resembling a flare from the frame of observer (e.g., Raiteri et al. 2017), in contrast to our calculations, which were based on a single time-averaged δ for C2 during a long period in ∼2022−2024. Below, we adopt a toy model in which the jet Doppler factor was as large as δ∼30 at the time of IceCube-211208A, and it later decreased to δ∼7.6 with an increasing jet viewing angle (i.e., jet bending away from the observer). For this, we show in Fig. 12 the relation between the Doppler factor δ = 1/(Γ(1−β cos θ)) and βapp for various Γ and θ. For δ∼30 and a fixed βapp = 4.72±0.43, we find that θ∼0.6° and Γ∼15 are required. We note that somewhat less relativistic values of Γ∼7−10 have been reported in the jet of PKS 0735+178 by Weaver et al. (2022) for 2007–2018. To achieve a lower δvar = 7.59±3.15 with the same βapp, smaller Γvar = 5.53±0.97 and larger θvar = 6.83°±4.11° are necessary, implying not only jet bending, but also a significant jet deceleration. We note that significant decelerations are also observed in jets of blazars in general on scales of ∼10−100 pc (projected; Homan et al. 2015). Although there might be various physical reasons for the jet bending (see, e.g., discussions in Kim et al. 2020), from observational perspectives, Conway & Murphy (1993) and Singal (2016) noted for the jet viewing angle that a change in the apparent position angle by ∼90° could result from a change of only a few degrees in the intrinsic θ for a large bulk Lorentz factor of Γ∼10. This would be compatible with the observed kinematics of C2. In this perspective, the change in θ∼0.6°to6.8° is physically not impossible. An additional joint analysis, especially using the temporal evolution of the radio synchrotron spectra, would be able to examine whether the above-mentioned temporal change in the Doppler factor could reproduce the synchrotron peak frequency and peak flux density (see, e.g., Fromm et al. 2011).
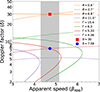 |
Fig. 12. Relations between observed apparent speeds and Doppler factors for various ranges of the Lorentz factors and viewing angles. The gray shaded area denotes the range of observed βapp for C2. δ = 30 indicates the value of the Doppler factor used in the literature for the theoretical modeling (Sahakyan et al. 2023; Acharyya et al. 2023; Prince et al. 2024), and δ = 7.59 corresponds to the value estimated for C2. |
6. Conclusions
We studied the VLBI-scale radio flux and the spectral and structural changes of the jet in PKS 0735+178 around the time of the IceCube-211208A high energy neutrino event in detail in order to localize the site of the neutrino emission and to constrain physical properties of the jet. This can shed light on the production of extragalactic TeV-PeV neutrinos from AGNs. Our main conclusions are summarized below.
-
As pointed out by various studies (e.g., Sahakyan et al. 2023; Acharyya et al. 2023; Prince et al. 2024), PKS 0735+178 was in a highly elevated state in all electromagnetic wavelengths around the time of IceCube-211208A. At 15 and 43 GHz, the compact milliarcsecond-scale VLBI nuclear region accounts for the overall evolution of the radio light curves.
-
The VLBI nuclear region shows a significantly flatter synchrotron spectrum after the detection of IceCube-211208A (mean values of
 from before to after the IceCube-211208A event), suggesting an increased synchrotron opacity, and therefore, higher energies of the emitting particles in the compact nuclear region.
 -
We found a subluminal component (C1) at ∼0.1−0.2 mas downstream of the VLBI core (C0) after the IceCube-211208A event and the appearance of a new VLBI component (C2) from the core before the time of IceCube-211208A. Remarkably, the C2 component apparently passed through C1 at the time of IceCube-211208A within a statistical uncertainty of 1σ. This suggests that the location of this apparent passage might be the probable spatial origin of the high-energy neutrino.
-
In particular, the C2 component traveled at an apparent speed of βapp∼4.8, which is comparable to the previously measured maximum speeds in the jet of PKS 0735+178 (Lister et al. 2019; Weaver et al. 2022). This suggests that its origin is related to the underlying bulk relativistic jet flow. The Doppler and Lorentz factors of C2 were estimated from the flux variability to be δvar∼7.6 and Γvar∼5.3. This resulted in a slightly large viewing angle of θvar∼6.8°. Our derived δ and Γ are somewhat smaller than those reported about PKS 0735+178 in the literature (Weaver et al. 2022). On the other hand, the component C2 is significantly bent in its sky-projected trajectory by ∼50°, followed by the component deceleration and a significant rebrightening after ∼MJD 60000. This behavior might be explained by a helical jet motion and the local beaming effect, but continued monitoring of C2 is needed for confirmation.
-
On the other hand, the subluminal speed of C1 below the median jet speed suggests a pattern-like origin, such as a traveling shock, instabilities, or a standing shock that is temporarily displaced from its stable position. No single scenario can fully explain the bright emission and the jet kinematics simultaneously, however. This complexity is expected considering that the source underwent a strong outburst close to the time of IceCube-211208A, which might also have accompanied significant changes in the jet structure compared to its previous quiescent periods.
-
The apparent C1–C2 overlap region lies too far away from the central engine, ≳6.5 pc (deprojected, using the above jet viewing angle). The large distance challenges external inverse-Compton scattering models in the literature (e.g., Prince et al. 2024), in which the BLR provides a sufficient external photon field. We therefore suggest that other sources of external photons are required or models that are less sensitive to the external photon field (e.g., the spine-sheath model; Tavecchio & Ghisellini 2015).
-
Last, to reconcile the discrepancy in the observed small and required large Doppler factors (i.e., δvar∼7.6 from our observational study versus δ∼30 used by models in the literature; e.g., Sahakyan et al. 2023), we suggested a toy model, in which C2 initially had amore relativistic speed (Γ∼15) and smaller viewing angle (θ∼0.6°), which is sufficient to reproduce δ∼30, but that the jet speed decreased and bent away from observer to larger θ, which decreases δ to the observed values. An apparently large position-angle change of ∼50° in C2 might support this toy model.
We demonstrated the importance of high-resolution,time-monitoring VLBI observations of neutrino blazar candidates overall for resolving, localizing, and tracking neutrino-emitting plasma and its physics. Follow-up studies with a quantitative modeling of the SED of PKS 0735+178 using boundary conditions obtained by our study will provide more realistic scenarios of the IceCube-211208A event and contemporaneous multiwavelength flares. Continued higher-resolution and polarimetric VLBI observations of neutrino blazar candidates will also be helpful in probing their particle acceleration mechanisms, magnetic field properties, and the transverse jet structure (e.g., the spine-sheath configuration), which can be related to the origins of the seed photons and jet dynamics.
Data availability
Tables A.1 and A.2 in Appendix are available at https://doi.org/10.5281/zenodo.15598199.
Acknowledgments
We thank the anonymous referee for helpful comments which improved the manuscript. J.-Y.K. is grateful to Yuri Y. Kovalev for insightful suggestions and discussions, and Svetlana G. Jorstad for comments about the VLBA 43 GHz data of PKS 0735+178. Y.-S.K. and J.-Y.K. are supported for this research by the National Research Foundation of Korea (NRF) grant funded by the Korean government (Ministry of Science and ICT; grant no. 2022R1C1C1005255, RS-2022-NR071771, RS-2022-00197685). This study makes use of VLBA data from the VLBA-BU Blazar Monitoring Program (BEAM-ME and VLBA-BU-BLAZAR; http://www.bu.edu/blazars/BEAM-ME.html), funded by NASA through the Fermi Guest Investigator Program. The VLBA is an instrument of the National Radio Astronomy Observatory. The National Radio Astronomy Observatory is a facility of the National Science Foundation operated by Associated Universities, Inc. This research has made use of data from the MOJAVE database that is maintained by the MOJAVE team (Lister et al. 2018). We acknowledge the use of the Astrophysics Data System (ADS), the Fermi-LAT Light Curve Repository (LCR), and the ASAS-SN sky server.
References
- Abbasi, R., Ackermann, M., Adams, J., et al. 2023, ApJS, 269, 25 [CrossRef] [Google Scholar]
- Abdollahi, S., Acero, F., Ackermann, M., et al. 2020, ApJS, 247, 33 [Google Scholar]
- Abdollahi, S., Ajello, M., Baldini, L., et al. 2023, ApJS, 265, 31 [NASA ADS] [CrossRef] [Google Scholar]
- Acharyya, A., Adams, C. B., Archer, A., et al. 2023, ApJ, 954, 70 [NASA ADS] [CrossRef] [Google Scholar]
- Agudo, I., Gómez, J. -L., Martí, J. -M., et al. 2001, ApJ, 549, L183 [Google Scholar]
- Agudo, I., Gómez, J. L., Gabuzda, D. C., et al. 2006, A&A, 453, 477 [NASA ADS] [CrossRef] [EDP Sciences] [Google Scholar]
- Dzhilkibaev, Z. A., Suvorova, O., & Baikal-GVD Collaboration 2021, ATel., 15112, 1 [Google Scholar]
- Petkov, V. B., Novoseltsev, Y. F., Novoseltseva, R. V., & Baksan Underground Scintillation Telescope Group 2021, ATel., 15143, 1 [Google Scholar]
- Beuchert, T., Kadler, M., Perucho, M., et al. 2018, A&A, 610, A32 [NASA ADS] [CrossRef] [EDP Sciences] [Google Scholar]
- Bharathan, A. M., Stalin, C. S., Sahayanathan, S., Bhattacharyya, S., & Mathew, B. 2024, MNRAS, 529, 3503 [NASA ADS] [CrossRef] [Google Scholar]
- Blandford, R. D., & Königl, A. 1979, ApJ, 232, 34 [Google Scholar]
- Boettcher, M., Harris, D. E., & Krawczynski, H. 2012, Relativistic Jets from Active Galactic Nuclei [Google Scholar]
- Britzen, S., Zajaček, M., Popović, L. Č., et al. 2021, MNRAS, 503, 3145 [NASA ADS] [CrossRef] [Google Scholar]
- Carilli, C. L., Perley, R. A., Dhawan, V., & Perley, D. A. 2019, ApJ, 874, L32 [Google Scholar]
- Casadio, C., Gómez, J. L., Jorstad, S. G., et al. 2015, ApJ, 813, 51 [Google Scholar]
- Cawthorne, T. V. 2006, MNRAS, 367, 851 [NASA ADS] [CrossRef] [Google Scholar]
- Cerruti, M., Zech, A., Boisson, C., et al. 2019, MNRAS, 483, L12 [NASA ADS] [CrossRef] [Google Scholar]
- Cohen, M. H., Meier, D. L., Arshakian, T. G., et al. 2014, ApJ, 787, 151 [Google Scholar]
- Conway, J. E., & Murphy, D. W. 1993, ApJ, 411, 89 [NASA ADS] [CrossRef] [Google Scholar]
- Daly, R. A., & Marscher, A. P. 1988, ApJ, 334, 539 [Google Scholar]
- Das, S., Gupta, N., & Razzaque, S. 2021, ApJ, 910, 100 [NASA ADS] [CrossRef] [Google Scholar]
- Dermer, C. D., Murase, K., & Inoue, Y. 2014, J. High Energy Astrophys., 3, 29 [NASA ADS] [Google Scholar]
- Falomo, R., Treves, A., & Paiano, S. 2021, ATel., 15132, 1 [Google Scholar]
- Filippini, F., Illuminati, G., Heijboer, A., et al. 2022, ATel., 15290, 1 [Google Scholar]
- Fromm, C. M., Perucho, M., Ros, E., et al. 2011, A&A, 531, A95 [NASA ADS] [CrossRef] [EDP Sciences] [Google Scholar]
- Fromm, C. M., Ros, E., Perucho, M., et al. 2013, A&A, 551, A32 [NASA ADS] [CrossRef] [EDP Sciences] [Google Scholar]
- Fromm, C. M., Perucho, M., Mimica, P., & Ros, E. 2016, A&A, 588, A101 [NASA ADS] [CrossRef] [EDP Sciences] [Google Scholar]
- Fuentes, A., Gómez, J. L., Martí, J. M., et al. 2023, Nat. Astron., 7, 1359 [NASA ADS] [CrossRef] [Google Scholar]
- Gabuzda, D. C., Wardle, J. F. C., Roberts, D. H., Aller, M. F., & Aller, H. D. 1994, ApJ, 435, 128 [Google Scholar]
- Garrappa, S., Buson, S., Franckowiak, A., et al. 2019, ApJ, 880, 103 [NASA ADS] [CrossRef] [Google Scholar]
- Gehrels, N., Chincarini, G., Giommi, P., et al. 2004, ApJ, 611, 1005 [Google Scholar]
- Ghisellini, G., Tavecchio, F., & Chiaberge, M. 2005, A&A, 432, 401 [CrossRef] [EDP Sciences] [Google Scholar]
- Giommi, P., Glauch, T., Padovani, P., et al. 2020, MNRAS, 497, 865 [Google Scholar]
- Gómez, J. L., Martí, J. M., Marscher, A. P., Ibáñez, J. M., & Alberdi, A. 1997, ApJ, 482, L33 [Google Scholar]
- Gómez, J. L., Guirado, J. C., Agudo, I., et al. 2001a, MNRAS, 328, 873 [Google Scholar]
- Gómez, J. -L., Marscher, A. P., Alberdi, A., Jorstad, S. G., & Agudo, I. 2001b, ApJ, 561, L161 [NASA ADS] [CrossRef] [Google Scholar]
- Hardee, P. E. 2000, ApJ, 533, 176 [Google Scholar]
- Hodgson, J. A., Krichbaum, T. P., Marscher, A. P., et al. 2017, A&A, 597, A80 [NASA ADS] [CrossRef] [EDP Sciences] [Google Scholar]
- Homan, D. C., Lister, M. L., Kovalev, Y. Y., et al. 2015, ApJ, 798, 134 [Google Scholar]
- Homan, D. C., Cohen, M. H., Hovatta, T., et al. 2021, ApJ, 923, 67 [NASA ADS] [CrossRef] [Google Scholar]
- Hovatta, T., Lindfors, E., Kiehlmann, S., et al. 2021, A&A, 650, A83 [NASA ADS] [CrossRef] [EDP Sciences] [Google Scholar]
- IceCube Collaboration (Aartsen, M. G., et al.) 2018a, Science, 361, 147 [NASA ADS] [Google Scholar]
- IceCube Collaboration (Aartsen, M. G., et al.) 2018b, Science, 361, 1378 [Google Scholar]
- IceCube Collaboration 2021, GRB Coordinates Network, 31191, 1 [Google Scholar]
- Jaffe, W., Meisenheimer, K., Röttgering, H. J. A., et al. 2004, Nature, 429, 47 [NASA ADS] [CrossRef] [Google Scholar]
- Jeong, H. -W., Lee, S. -S., Cheong, W. Y., et al. 2023, MNRAS, 523, 5703 [Google Scholar]
- Jorstad, S., & Marscher, A. 2016, Galaxies, 4, 47 [Google Scholar]
- Jorstad, S. G., Marscher, A. P., Morozova, D. A., et al. 2017, ApJ, 846, 98 [Google Scholar]
- Kadler, M., Ros, E., Perucho, M., et al. 2008, ApJ, 680, 867 [NASA ADS] [CrossRef] [Google Scholar]
- Kim, J. -Y., Lee, S. -S., Hodgson, J. A., et al. 2018a, A&A, 610, L5 [NASA ADS] [CrossRef] [EDP Sciences] [Google Scholar]
- Kim, J. Y., Krichbaum, T. P., Lu, R. S., et al. 2018b, A&A, 616, A188 [NASA ADS] [CrossRef] [EDP Sciences] [Google Scholar]
- Kim, J. Y., Krichbaum, T. P., Marscher, A. P., et al. 2019, A&A, 622, A196 [NASA ADS] [CrossRef] [EDP Sciences] [Google Scholar]
- Kim, J. -Y., Krichbaum, T. P., Broderick, A. E., et al. 2020, A&A, 640, A69 [NASA ADS] [CrossRef] [EDP Sciences] [Google Scholar]
- Kim, J. -Y., Savolainen, T., Voitsik, P., et al. 2023, ApJ, 952, 34 [NASA ADS] [CrossRef] [Google Scholar]
- Kishimoto, M., Hönig, S. F., Beckert, T., & Weigelt, G. 2007, A&A, 476, 713 [NASA ADS] [CrossRef] [EDP Sciences] [Google Scholar]
- Kochanek, C. S., Shappee, B. J., Stanek, K. Z., et al. 2017, PASP, 129, 104502 [Google Scholar]
- Lisakov, M. M., Kovalev, Y. Y., Savolainen, T., Hovatta, T., & Kutkin, A. M. 2017, MNRAS, 468, 4478 [Google Scholar]
- Lister, M. L., Cohen, M. H., Homan, D. C., et al. 2009, AJ, 138, 1874 [NASA ADS] [CrossRef] [Google Scholar]
- Lister, M. L., Aller, M. F., Aller, H. D., et al. 2018, ApJS, 234, 12 [CrossRef] [Google Scholar]
- Lister, M. L., Homan, D. C., Hovatta, T., et al. 2019, ApJ, 874, 43 [NASA ADS] [CrossRef] [Google Scholar]
- Lister, M. L., Homan, D. C., Kellermann, K. I., et al. 2021, ApJ, 923, 30 [NASA ADS] [CrossRef] [Google Scholar]
- Lobanov, A. P. 1998, A&A, 330, 79 [NASA ADS] [Google Scholar]
- Marscher, A. P. 2014, ApJ, 780, 87 [Google Scholar]
- Marscher, A. P., & Gear, W. K. 1985, ApJ, 298, 114 [Google Scholar]
- Marscher, A. P., Gear, W. K., & Travis, J. P. 1992, in Variability of Blazars, eds. E. Valtaoja, & M. Valtonen, 85 [Google Scholar]
- Mertens, F., Lobanov, A. P., Walker, R. C., & Hardee, P. E. 2016, A&A, 595, A54 [NASA ADS] [CrossRef] [EDP Sciences] [Google Scholar]
- Mészáros, P., Fox, D. B., Hanna, C., & Murase, K. 2019, Nat. Rev. Phys., 1, 585 [Google Scholar]
- Niinuma, K., Kino, M., Doi, A., et al. 2015, ApJ, 807, L14 [NASA ADS] [CrossRef] [Google Scholar]
- Nilsson, K., Pursimo, T., Villforth, C., et al. 2012, A&A, 547, A1 [NASA ADS] [CrossRef] [EDP Sciences] [Google Scholar]
- Padovani, P., Oikonomou, F., Petropoulou, M., Giommi, P., & Resconi, E. 2019, MNRAS, 484, L104 [NASA ADS] [CrossRef] [Google Scholar]
- Paraschos, G. F., Mpisketzis, V., Kim, J. Y., et al. 2023, A&A, 669, A32 [NASA ADS] [CrossRef] [EDP Sciences] [Google Scholar]
- Perucho, M., Hanasz, M., Martí, J. M., & Sol, H. 2004, A&A, 427, 415 [NASA ADS] [CrossRef] [EDP Sciences] [Google Scholar]
- Planck Collaboration XVI. 2014, A&A, 571, A16 [NASA ADS] [CrossRef] [EDP Sciences] [Google Scholar]
- Plavin, A. V., Kovalev, Y. Y., Pushkarev, A. B., & Lobanov, A. P. 2019, MNRAS, 485, 1822 [Google Scholar]
- Plavin, A. V., Kovalev, Y. Y., Kovalev, Y. A., & Troitsky, S. V. 2021, ApJ, 908, 157 [Google Scholar]
- Plavin, A. V., Kovalev, Y. Y., Kovalev, Y. A., & Troitsky, S. V. 2023, MNRAS, 523, 1799 [NASA ADS] [CrossRef] [Google Scholar]
- Prince, R., Das, S., Gupta, N., Majumdar, P., & Czerny, B. 2024, MNRAS, 527, 8746 [Google Scholar]
- Pushkarev, A. B., Kovalev, Y. Y., Lister, M. L., & Savolainen, T. 2009, A&A, 507, L33 [NASA ADS] [CrossRef] [EDP Sciences] [Google Scholar]
- Raiteri, C. M., Villata, M., Acosta-Pulido, J. A., et al. 2017, Nature, 552, 374 [NASA ADS] [CrossRef] [Google Scholar]
- Ros, E., Kadler, M., Perucho, M., et al. 2020, A&A, 633, L1 [NASA ADS] [CrossRef] [EDP Sciences] [Google Scholar]
- Sahakyan, N., Giommi, P., Padovani, P., et al. 2023, MNRAS, 519, 1396 [Google Scholar]
- Schinzel, F. K., Lobanov, A. P., Taylor, G. B., et al. 2012, A&A, 537, A70 [NASA ADS] [CrossRef] [EDP Sciences] [Google Scholar]
- Shappee, B. J., Prieto, J. L., Grupe, D., et al. 2014, ApJ, 788, 48 [Google Scholar]
- Sharma, A. 2024, Universe, 10, 326 [Google Scholar]
- Shepherd, M. C. 1997, ASP Conf. Ser., 125, 77 [Google Scholar]
- Singal, A. K. 2016, ApJ, 827, 66 [Google Scholar]
- Stroh, M. C., & Falcone, A. D. 2013, ApJS, 207, 28 [NASA ADS] [CrossRef] [Google Scholar]
- Tavecchio, F., & Ghisellini, G. 2015, MNRAS, 451, 1502 [CrossRef] [Google Scholar]
- Tavecchio, F., Ghisellini, G., & Guetta, D. 2014, ApJ, 793, L18 [NASA ADS] [CrossRef] [Google Scholar]
- Traianou, E., Krichbaum, T. P., Gómez, J. L., et al. 2024, A&A, 682, A154 [NASA ADS] [CrossRef] [EDP Sciences] [Google Scholar]
- Virtanen, P., Gommers, R., Oliphant, T. E., et al. 2020, Nat. Methods, 17, 261 [Google Scholar]
- Weaver, Z. R., Jorstad, S. G., Marscher, A. P., et al. 2022, ApJS, 260, 12 [NASA ADS] [CrossRef] [Google Scholar]
Appendix A: Supplementary materials
In Fig. A.1 we show, for all the analyzed epochs, the positions and FWHM sizes of all the model-fit Gaussian components overlaid on the VLBA 43 GHz total intensity maps of PKS 0735+178. In Table A.1, available online at https://doi.org/10.5281/zenodo.15598199, the basic properties of all the CLEAN images, especially those used to obtain radio light curves and spectral indices in Figs. 2, 3, and 4, are presented. We also show in Table A.2, also available online at the same address as Table A.1, detailed information of the Gaussian model components for the VLBA 43 GHz for all the analyzed epochs.
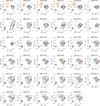 |
Fig. A.1. Distribution of model-fit Gaussian components overlaid on the total intensity maps from Difmap using the modelfit with uniform weighting. In each panel, the contours represent the 43 GHz intensity, crossed circles the location and FWHM sizes of the Gaussians, the labels C0 to C4 the component IDs, the gray ellipses the corresponding beam sizes, and the titles the observing epoch in year-month-day format. Contours start at three times the image rms noise level and increase by factor 2. |
All Tables
All Figures
|
Fig. 1. VLBI images of PKS 0735+178 on 10 December 2021 (left) and 14 December 2021 (right) at 43 (left) and 15 GHz (right). |
| In the text | |
|
Fig. 2. Multiwavelength light curves of PKS 0735+178. From top to bottom: 0.1–100 GeV γ-ray photon flux from Fermi-LAT, 0.3–10 keV photon count from Swift/XRT, optical g- and V-band flux densities from ASAS-SN, 15 and 43 GHz flux densities of the VLBI nuclear region from the VLBA (MOJAVE and BEAM-ME; see the text for the definition of the core), and the same, but for the entire compact jet. The vertical dashed gray lines mark the time of the IceCube-211208A event. |
| In the text | |
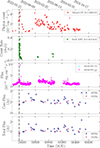 |
Fig. 3. Same as Fig. 2, but highlighting more recent flux measurements after about MJD 59400. |
| In the text | |
|
Fig. 4. Spectral indices of the nuclear region at 15–43 GHz. The vertical dashed line indicates the timing of IceCube-211208A, and the blue and red data points show the spectral indices before and after the neutrino events. The horizontal error bars represent timescales for the binning at 15 and 43 GHz. |
| In the text | |
|
Fig. 5. Positions of model-fit components from the analysis of the VLBA 43 GHz data of PKS 0735+178 during ∼2020−2024. Large left panel: Positions of all the components. Small right panels: Detailed time evolution of the position for the individual components. In all panels, the empty black circle represents the location of the VLBI core (C0). |
| In the text | |
|
Fig. 6. Radial distances r(t) of the moving components C1 to C4. The top panel shows the distances for all the components. The bottom panel shows the same information, but zoomed in smaller regions of time and radial distances to highlight C1 and C2. The empty circles represent model-fit but not uniquely identified components in both panels (see Sect. 3.2). The dashed green and red lines display linear models of r(t) fit to the data of C1 and C2, respectively. The light and dark gray regions indicate the timing of the ejection of C2 from the VLBI core (C0), MJD 59384.1±34.5, and the passage of C1 through C2, MJD 59575.53±50.41. The vertical dashed dark line corresponds to the timing of IceCube-211208A. |
| In the text | |
|
Fig. 7. Position angles of C1 to C4 over time. The vertical dashed line corresponds to the timing of IceCube-211208A. |
| In the text | |
|
Fig. 8. Flux densities (top), FWHM sizes (middle), and brightness temperatures (bottom) of the model-fit components C0 to C4. In all panels, the vertical dashed lines indicate the timing of IceCube-211208A. |
| In the text | |
|
Fig. 9. Log brightness temperatures vs. radial distances of the jet features C1 and C2 after the IceCube-211208A event. The slopes of the fit lines are −(2.37±0.53) and −(3.45±0.38) for C1 and C2, respectively. |
| In the text | |
|
Fig. 10. Flux density evolution of the component C2 vs. time. A linear model fit to the data is shown as a solid black line. |
| In the text | |
|
Fig. 11. Flux densities of the VLBI core (A0) and stationary components (A1 and A2) downstream of the jet in PKS 0735+178 that were identified before 2018, as reported by Weaver et al. (2022). |
| In the text | |
|
Fig. 12. Relations between observed apparent speeds and Doppler factors for various ranges of the Lorentz factors and viewing angles. The gray shaded area denotes the range of observed βapp for C2. δ = 30 indicates the value of the Doppler factor used in the literature for the theoretical modeling (Sahakyan et al. 2023; Acharyya et al. 2023; Prince et al. 2024), and δ = 7.59 corresponds to the value estimated for C2. |
| In the text | |
|
Fig. A.1. Distribution of model-fit Gaussian components overlaid on the total intensity maps from Difmap using the modelfit with uniform weighting. In each panel, the contours represent the 43 GHz intensity, crossed circles the location and FWHM sizes of the Gaussians, the labels C0 to C4 the component IDs, the gray ellipses the corresponding beam sizes, and the titles the observing epoch in year-month-day format. Contours start at three times the image rms noise level and increase by factor 2. |
| In the text | |
Current usage metrics show cumulative count of Article Views (full-text article views including HTML views, PDF and ePub downloads, according to the available data) and Abstracts Views on Vision4Press platform.
Data correspond to usage on the plateform after 2015. The current usage metrics is available 48-96 hours after online publication and is updated daily on week days.
Initial download of the metrics may take a while.