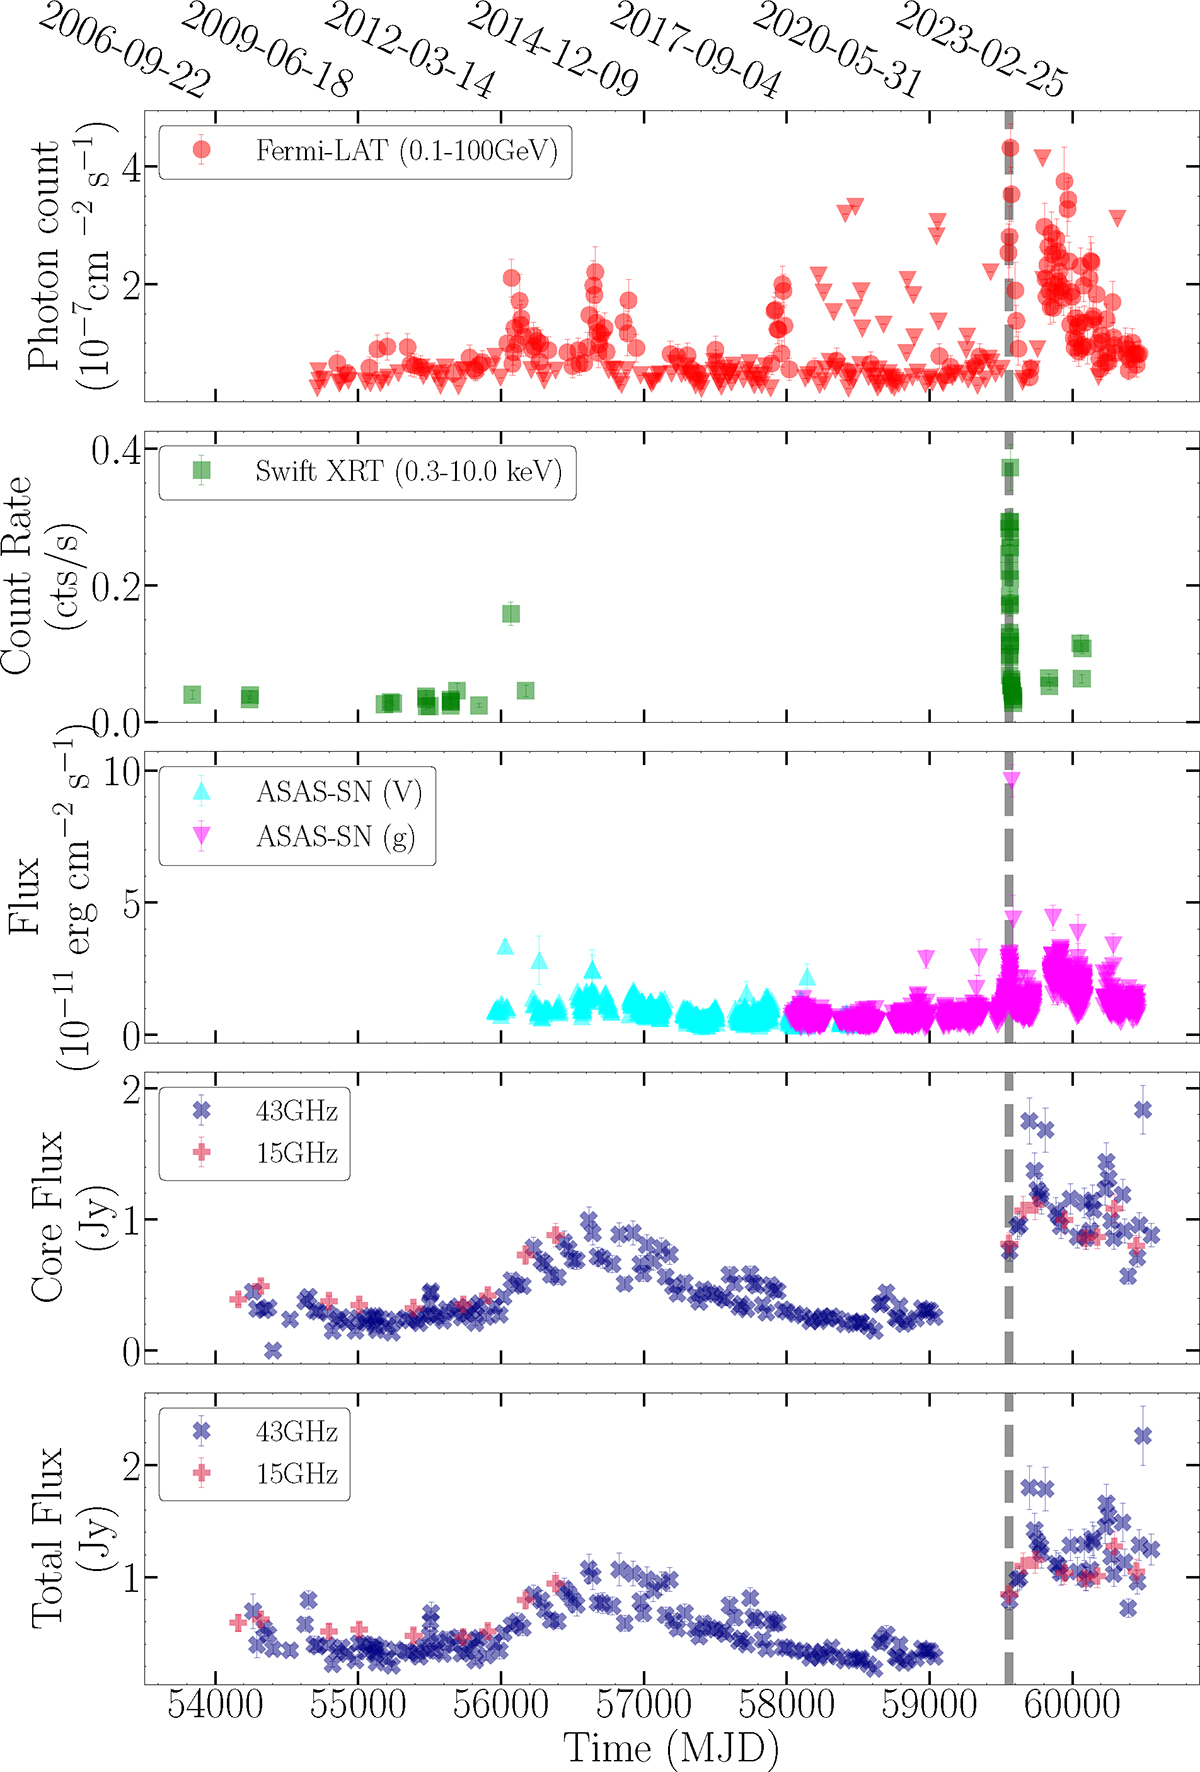
Fig. 2.
Download original image
Multiwavelength light curves of PKS 0735+178. From top to bottom: 0.1–100 GeV γ-ray photon flux from Fermi-LAT, 0.3–10 keV photon count from Swift/XRT, optical g- and V-band flux densities from ASAS-SN, 15 and 43 GHz flux densities of the VLBI nuclear region from the VLBA (MOJAVE and BEAM-ME; see the text for the definition of the core), and the same, but for the entire compact jet. The vertical dashed gray lines mark the time of the IceCube-211208A event.
Current usage metrics show cumulative count of Article Views (full-text article views including HTML views, PDF and ePub downloads, according to the available data) and Abstracts Views on Vision4Press platform.
Data correspond to usage on the plateform after 2015. The current usage metrics is available 48-96 hours after online publication and is updated daily on week days.
Initial download of the metrics may take a while.