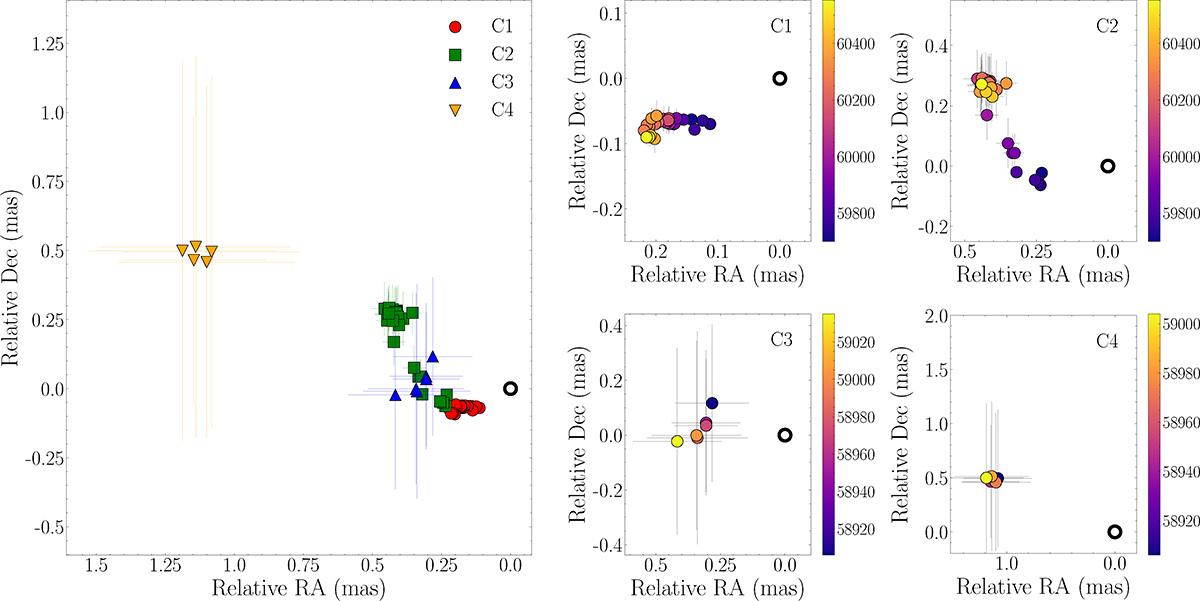
Fig. 5.
Download original image
Positions of model-fit components from the analysis of the VLBA 43 GHz data of PKS 0735+178 during ∼2020−2024. Large left panel: Positions of all the components. Small right panels: Detailed time evolution of the position for the individual components. In all panels, the empty black circle represents the location of the VLBI core (C0).
Current usage metrics show cumulative count of Article Views (full-text article views including HTML views, PDF and ePub downloads, according to the available data) and Abstracts Views on Vision4Press platform.
Data correspond to usage on the plateform after 2015. The current usage metrics is available 48-96 hours after online publication and is updated daily on week days.
Initial download of the metrics may take a while.