Fig. 4.
Download original image
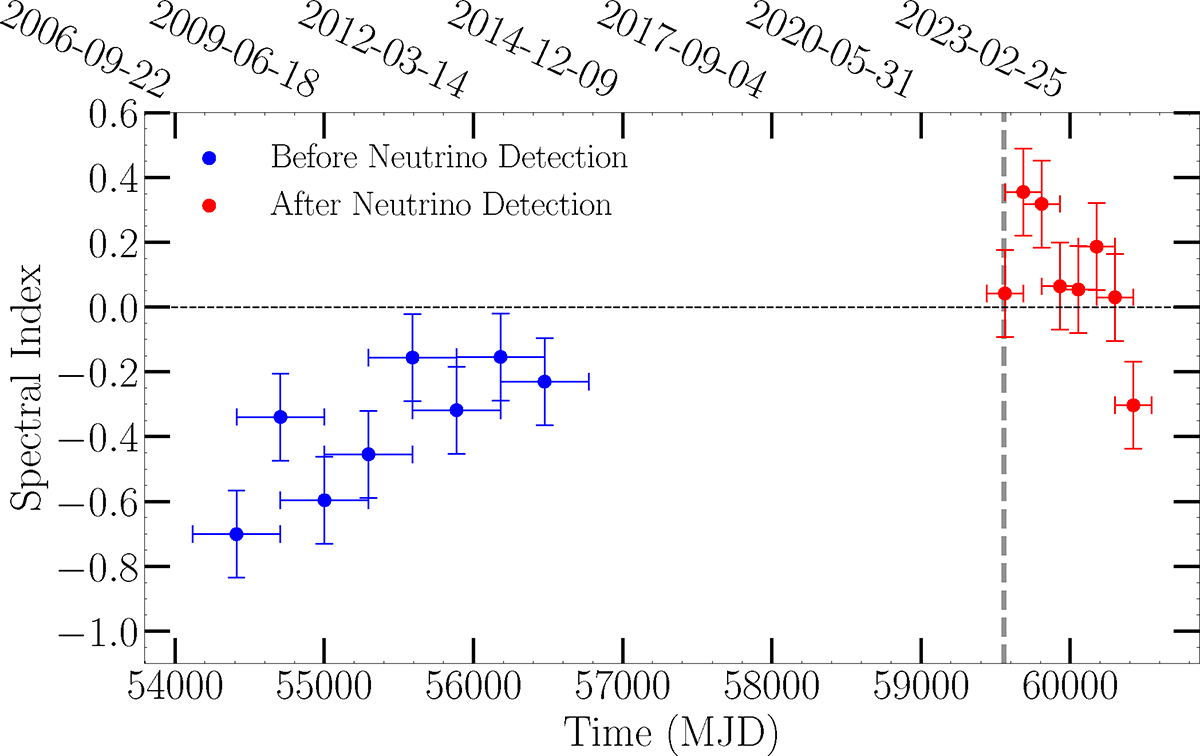
Spectral indices of the nuclear region at 15–43 GHz. The vertical dashed line indicates the timing of IceCube-211208A, and the blue and red data points show the spectral indices before and after the neutrino events. The horizontal error bars represent timescales for the binning at 15 and 43 GHz.
Current usage metrics show cumulative count of Article Views (full-text article views including HTML views, PDF and ePub downloads, according to the available data) and Abstracts Views on Vision4Press platform.
Data correspond to usage on the plateform after 2015. The current usage metrics is available 48-96 hours after online publication and is updated daily on week days.
Initial download of the metrics may take a while.