Fig. A.1.
Download original image
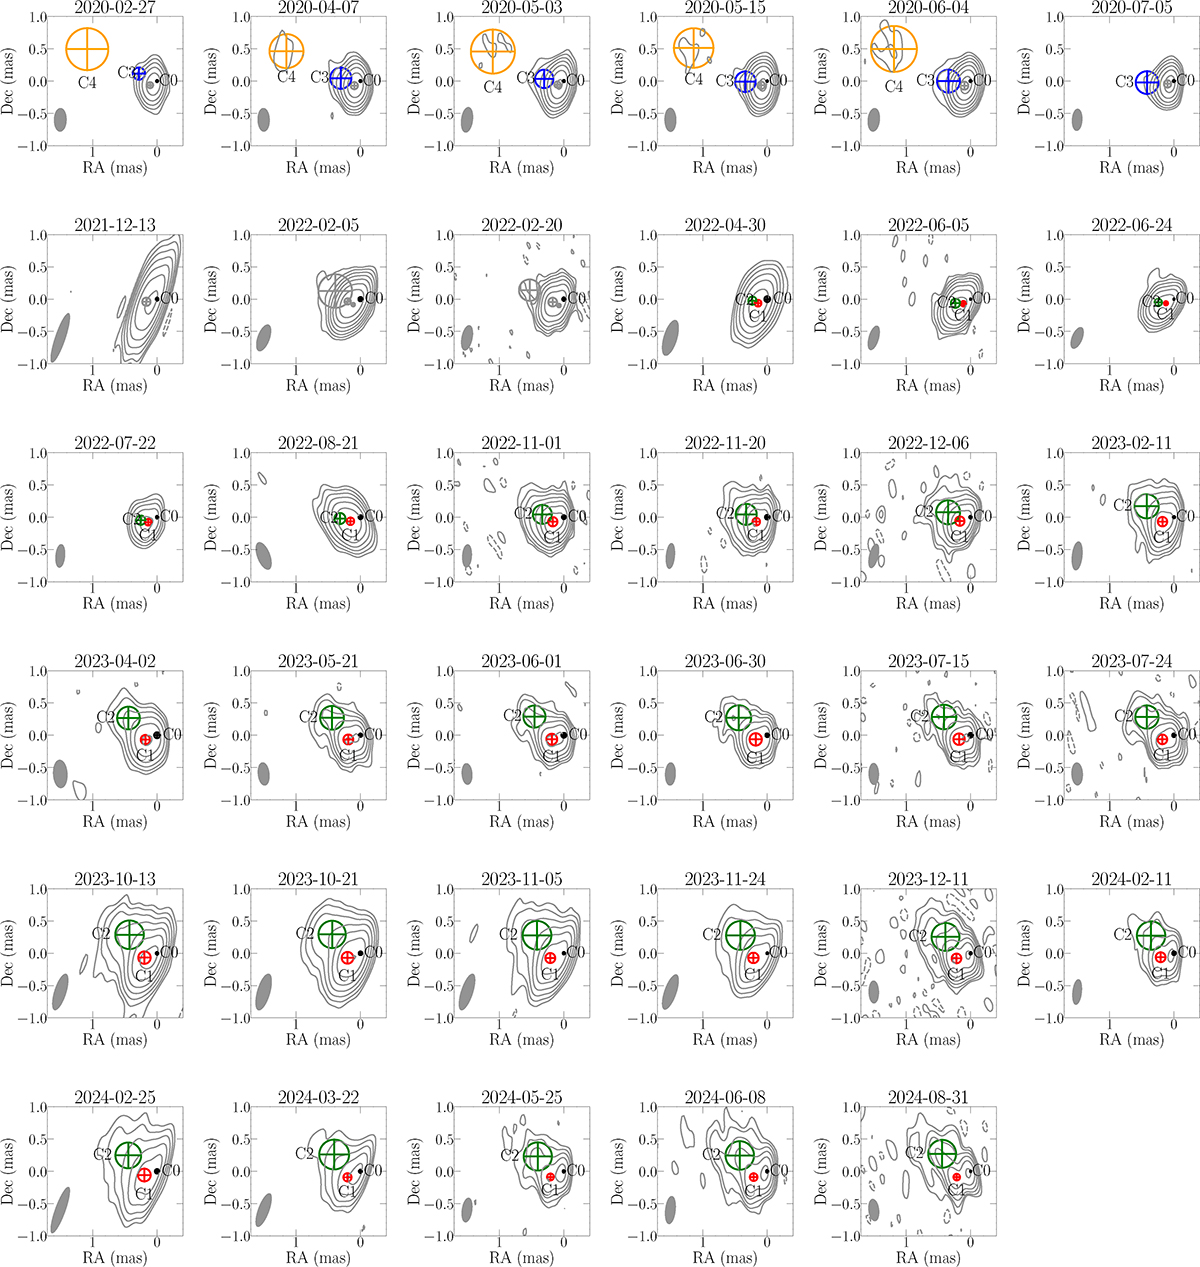
Distribution of model-fit Gaussian components overlaid on the total intensity maps from Difmap using the modelfit with uniform weighting. In each panel, the contours represent the 43 GHz intensity, crossed circles the location and FWHM sizes of the Gaussians, the labels C0 to C4 the component IDs, the gray ellipses the corresponding beam sizes, and the titles the observing epoch in year-month-day format. Contours start at three times the image rms noise level and increase by factor 2.
Current usage metrics show cumulative count of Article Views (full-text article views including HTML views, PDF and ePub downloads, according to the available data) and Abstracts Views on Vision4Press platform.
Data correspond to usage on the plateform after 2015. The current usage metrics is available 48-96 hours after online publication and is updated daily on week days.
Initial download of the metrics may take a while.