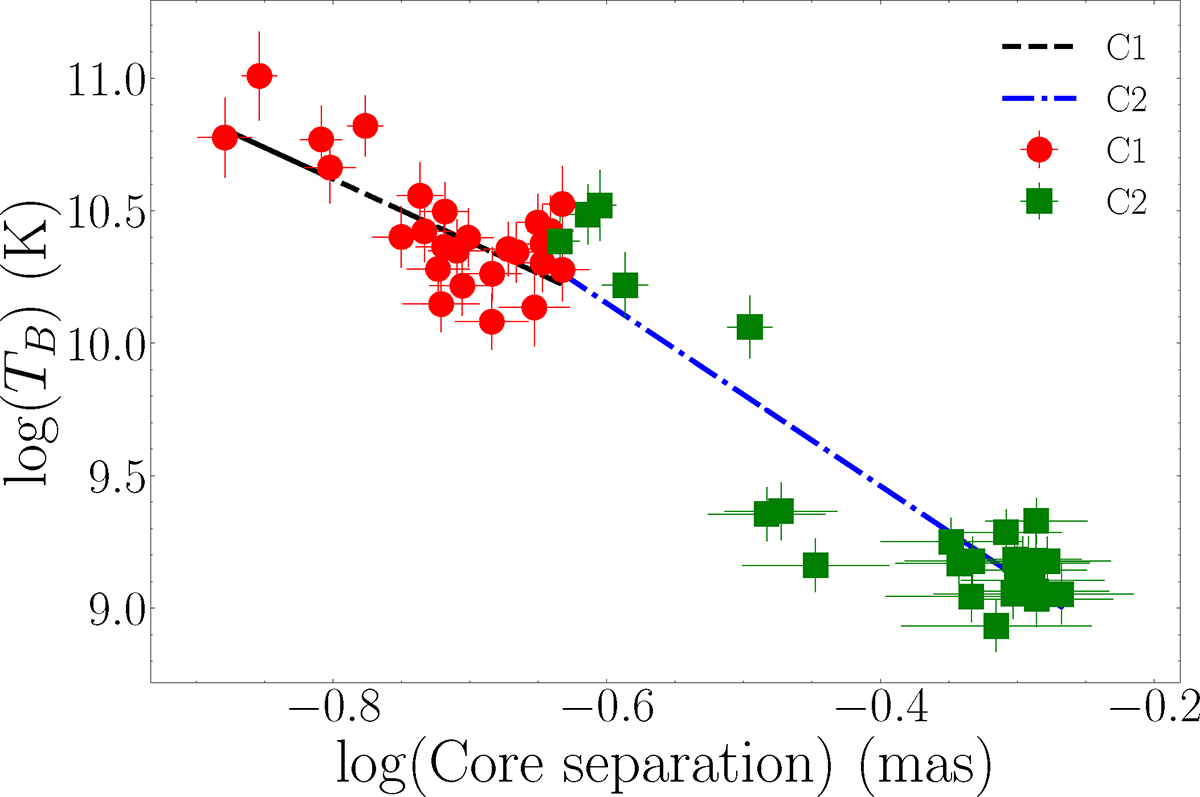
Fig. 9.
Download original image
Log brightness temperatures vs. radial distances of the jet features C1 and C2 after the IceCube-211208A event. The slopes of the fit lines are −(2.37±0.53) and −(3.45±0.38) for C1 and C2, respectively.
Current usage metrics show cumulative count of Article Views (full-text article views including HTML views, PDF and ePub downloads, according to the available data) and Abstracts Views on Vision4Press platform.
Data correspond to usage on the plateform after 2015. The current usage metrics is available 48-96 hours after online publication and is updated daily on week days.
Initial download of the metrics may take a while.