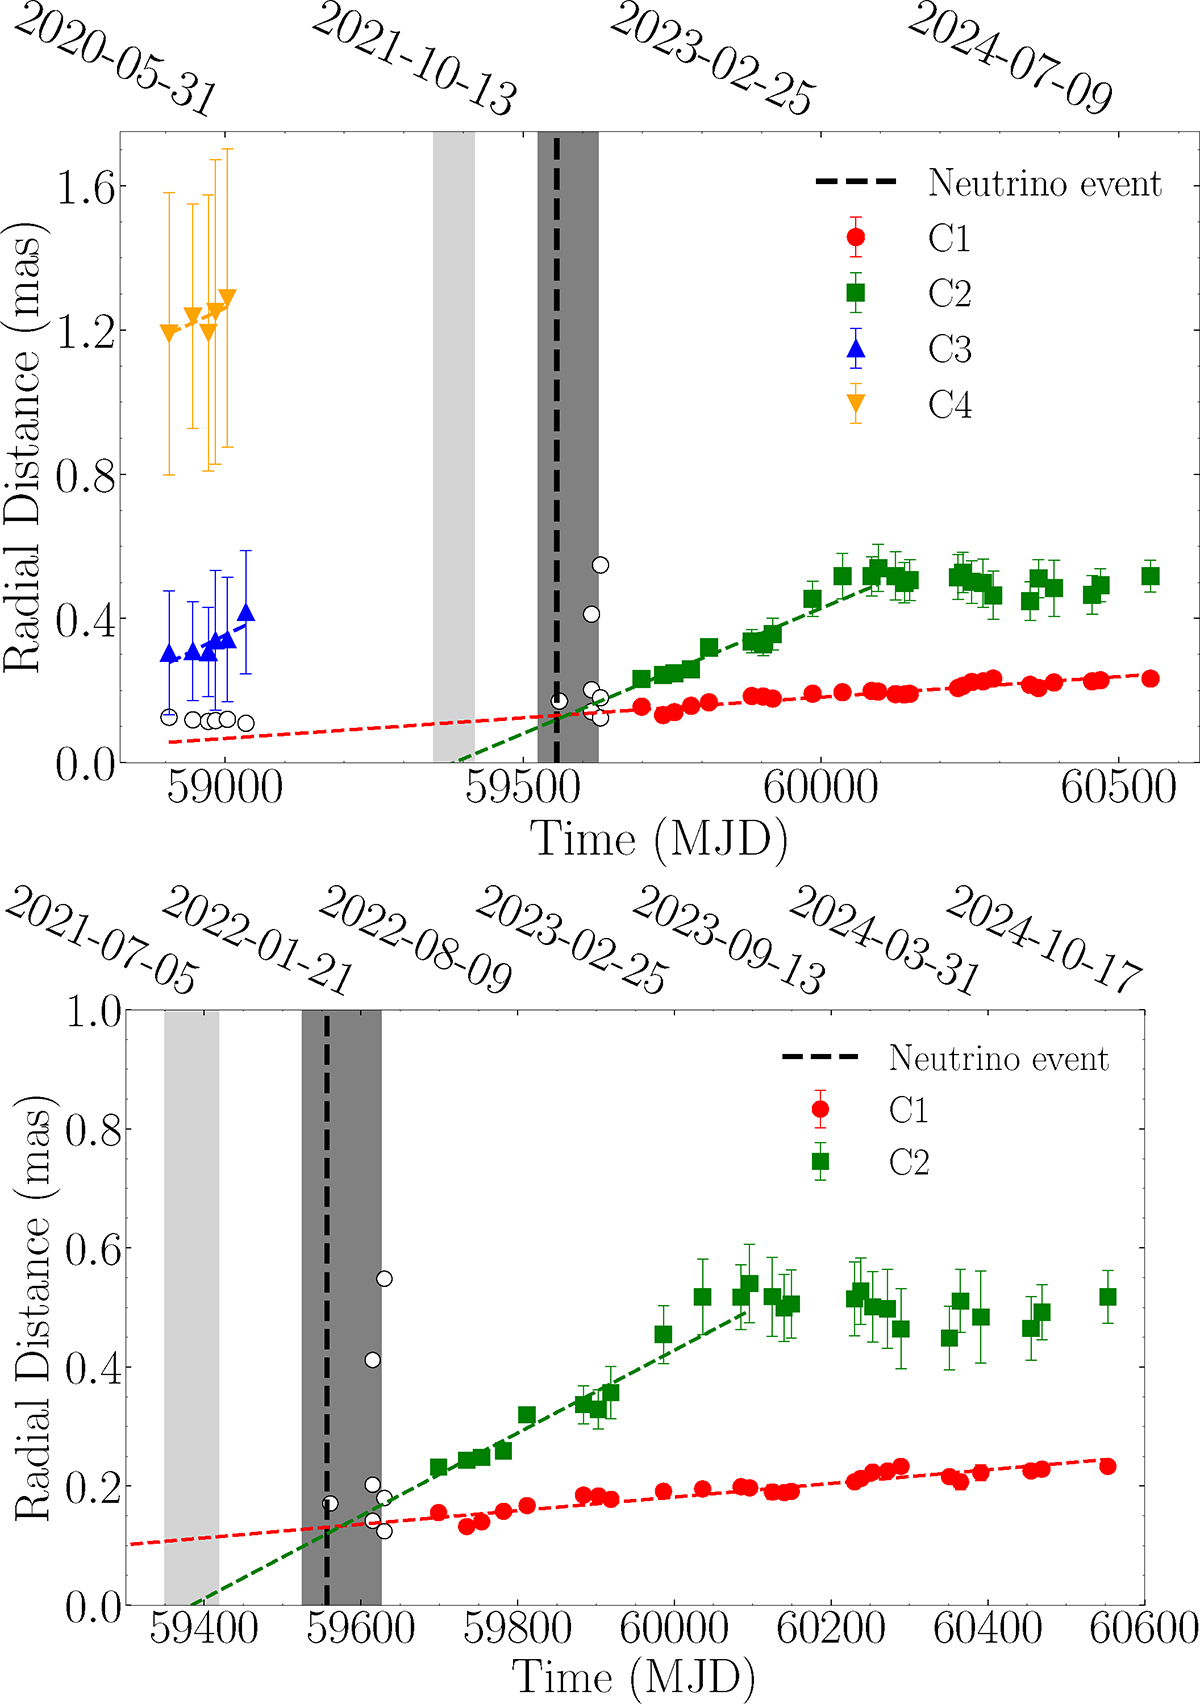
Fig. 6.
Download original image
Radial distances r(t) of the moving components C1 to C4. The top panel shows the distances for all the components. The bottom panel shows the same information, but zoomed in smaller regions of time and radial distances to highlight C1 and C2. The empty circles represent model-fit but not uniquely identified components in both panels (see Sect. 3.2). The dashed green and red lines display linear models of r(t) fit to the data of C1 and C2, respectively. The light and dark gray regions indicate the timing of the ejection of C2 from the VLBI core (C0), MJD 59384.1±34.5, and the passage of C1 through C2, MJD 59575.53±50.41. The vertical dashed dark line corresponds to the timing of IceCube-211208A.
Current usage metrics show cumulative count of Article Views (full-text article views including HTML views, PDF and ePub downloads, according to the available data) and Abstracts Views on Vision4Press platform.
Data correspond to usage on the plateform after 2015. The current usage metrics is available 48-96 hours after online publication and is updated daily on week days.
Initial download of the metrics may take a while.