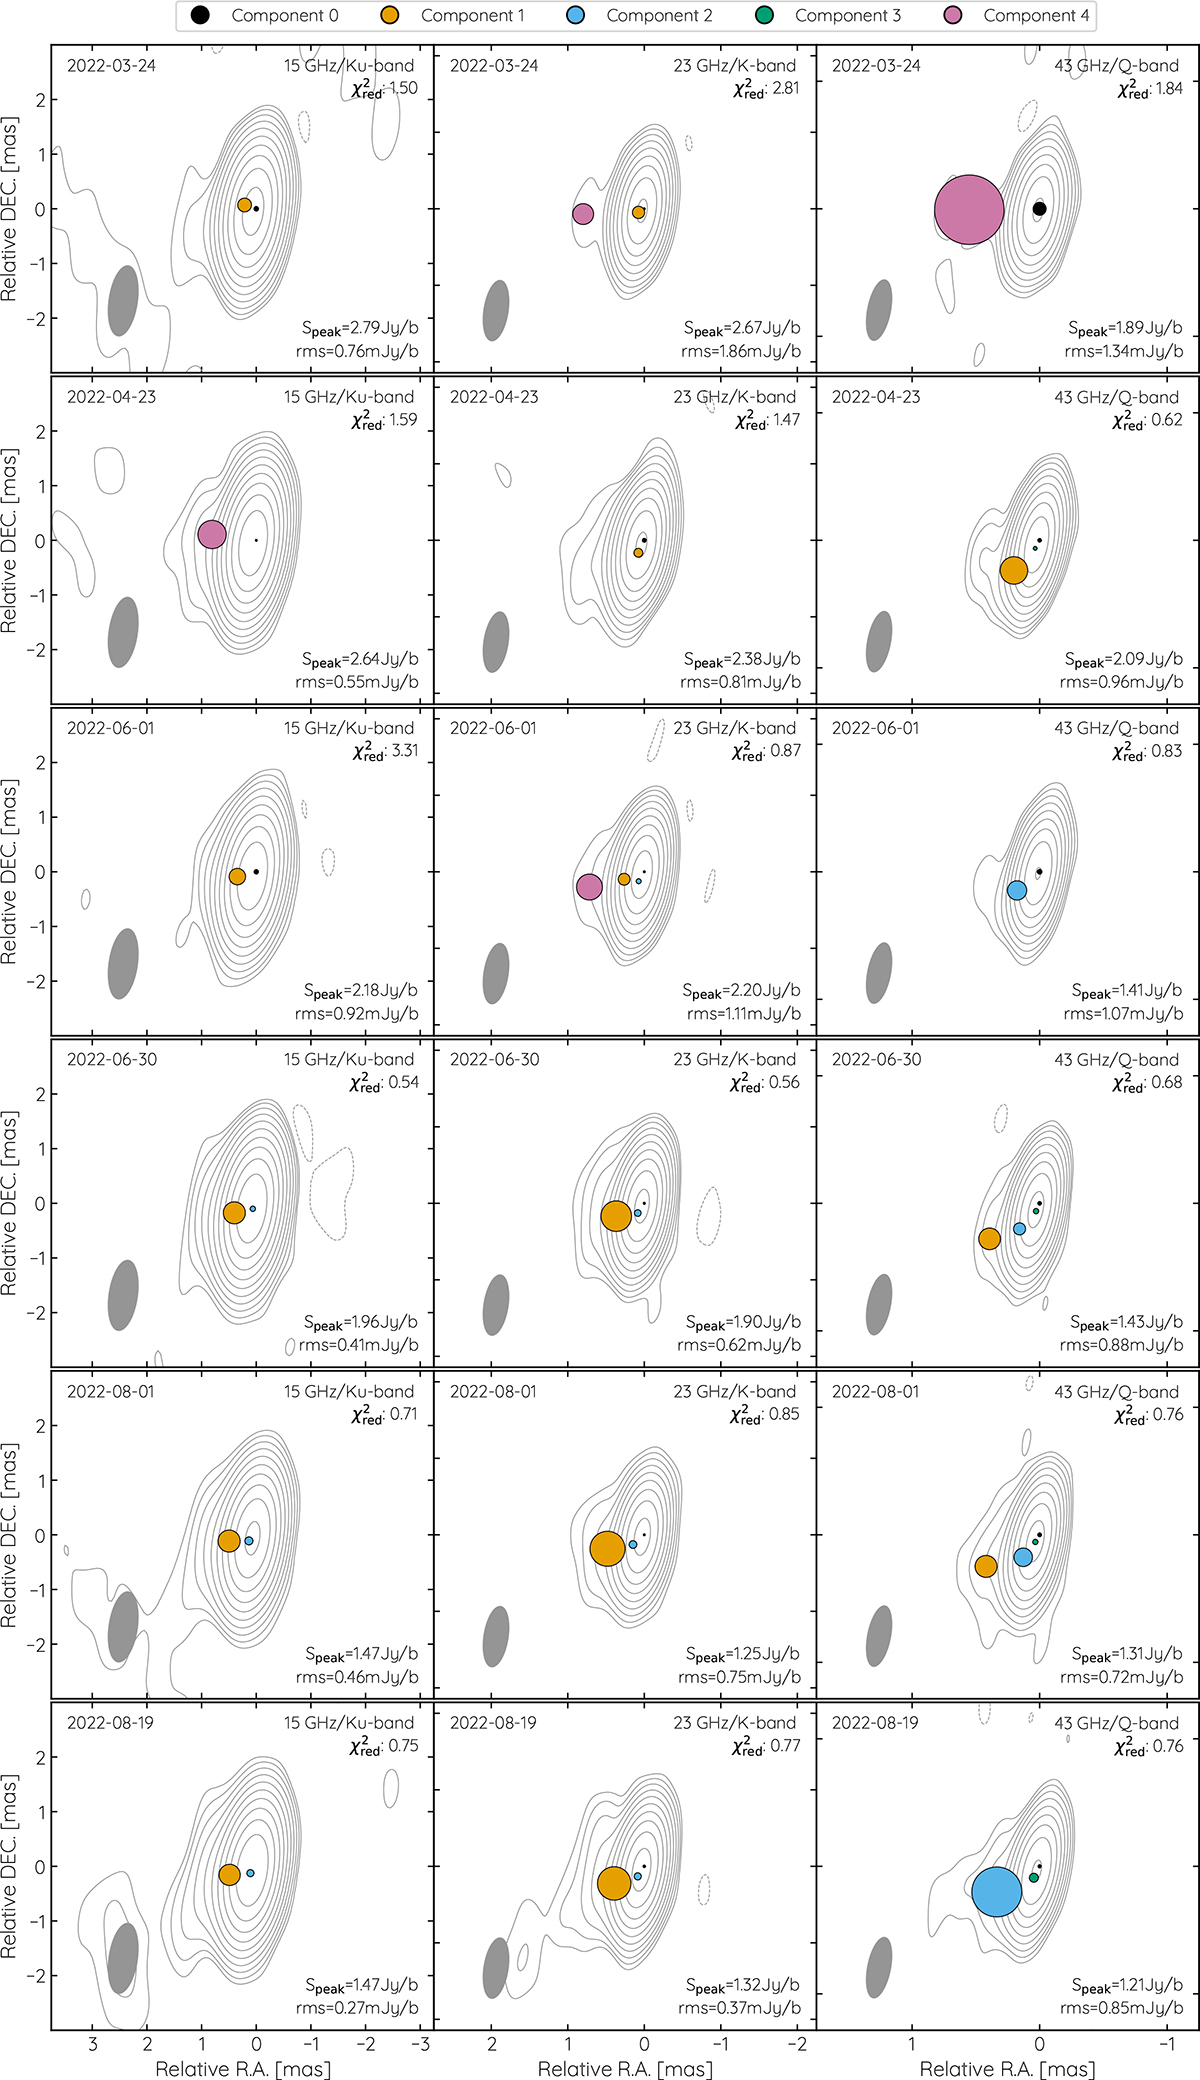
Fig. B.1.
Download original image
Total intensity contour plots, as shown in Fig. 6. Contours start at four times the noise level, increasing by a factor of two. The core component (component 0), and the modelfit components 1−4 are plotted on top of the contours, with their size corresponding to the full width at half maximum of the modelfit component. The reduced-χ2 value for the modelfit is shown in each panel. For unresolved components, the plotted component size corresponds to the resolution limit.
Current usage metrics show cumulative count of Article Views (full-text article views including HTML views, PDF and ePub downloads, according to the available data) and Abstracts Views on Vision4Press platform.
Data correspond to usage on the plateform after 2015. The current usage metrics is available 48-96 hours after online publication and is updated daily on week days.
Initial download of the metrics may take a while.