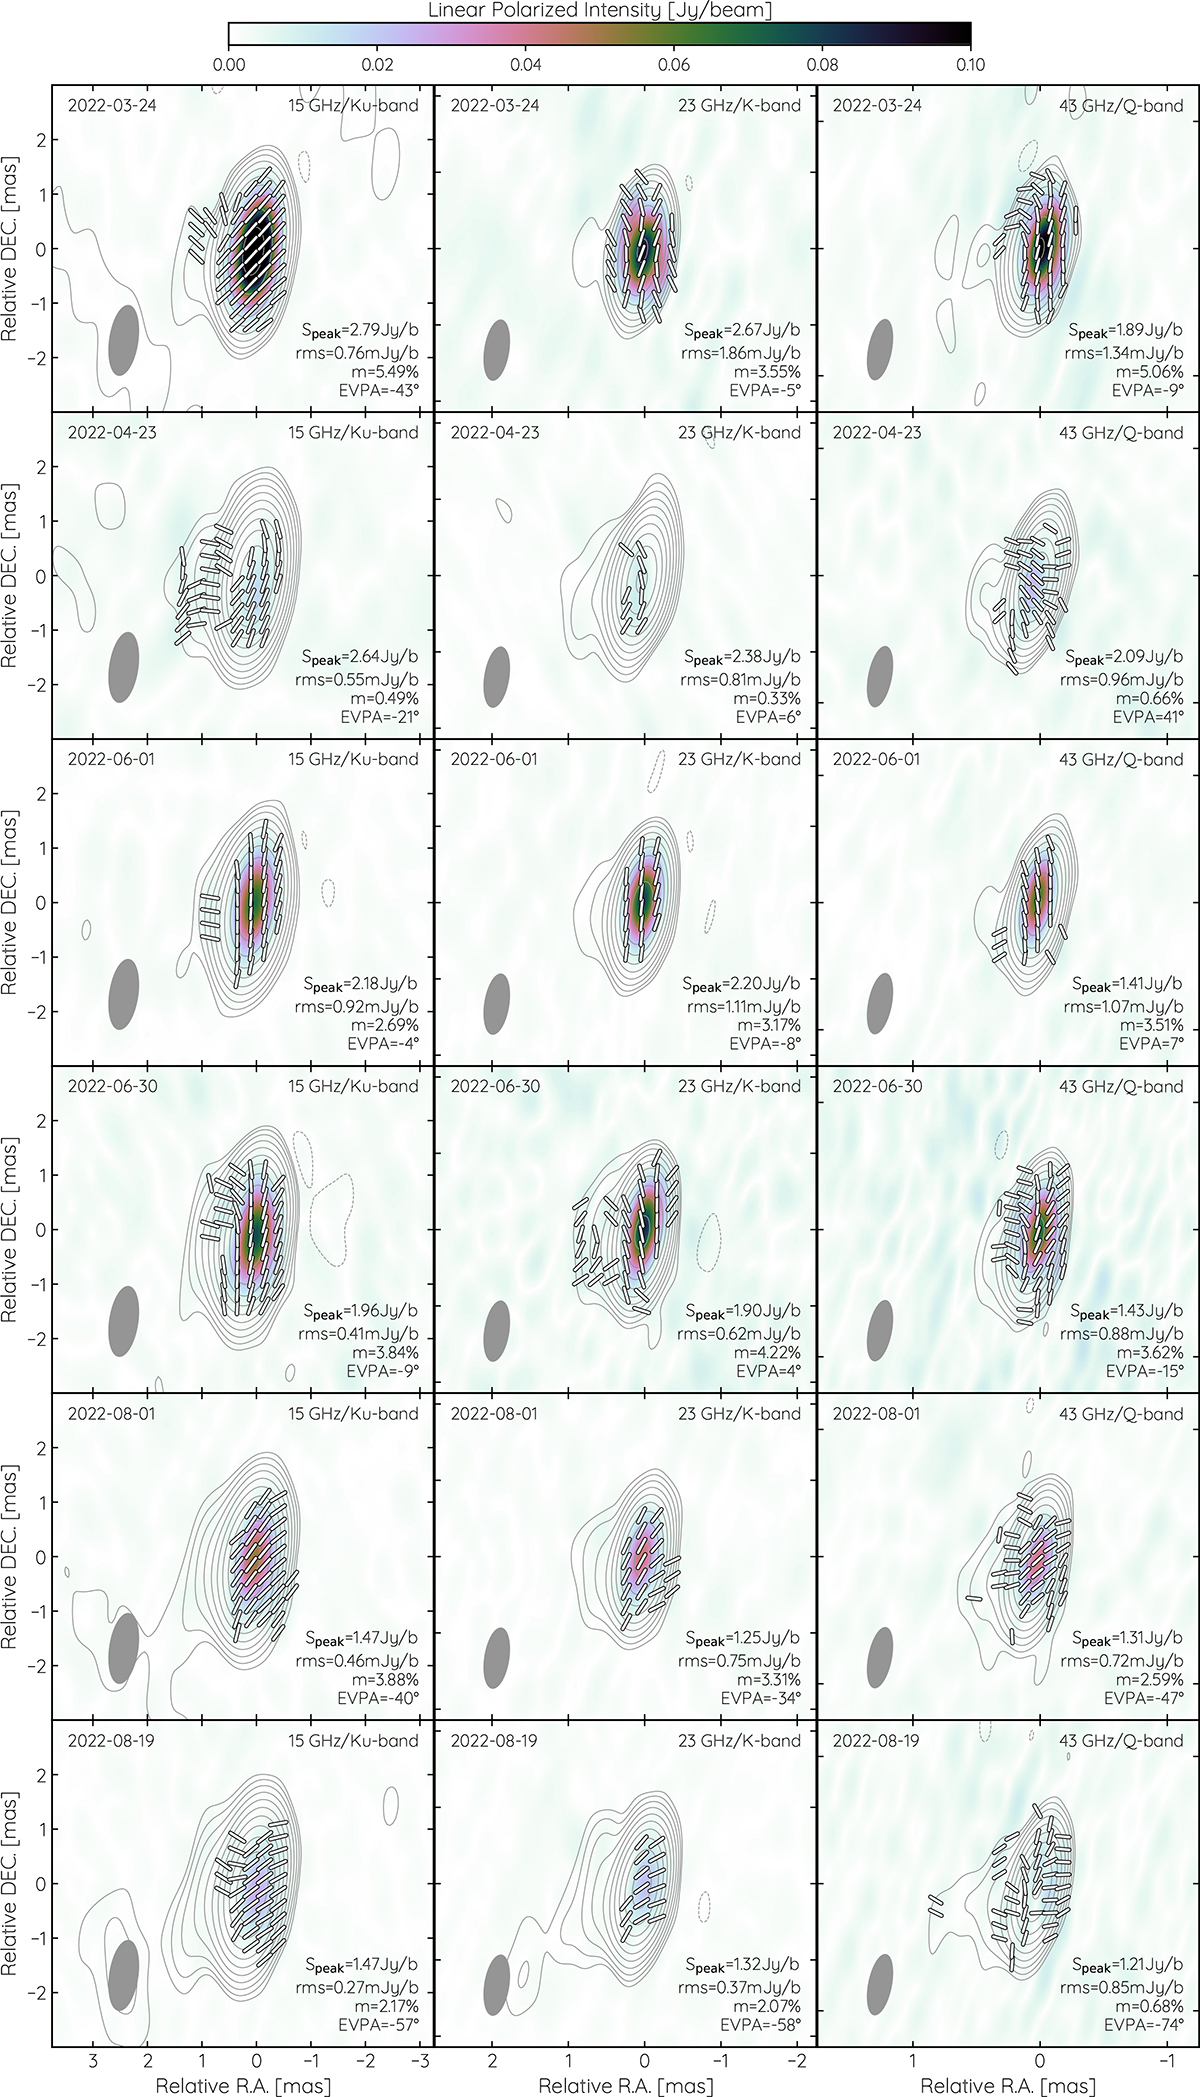
Fig. 6.
Download original image
Full polarization VLBI images of PKS 0215+015 from the conducted ToO campaign, convolved with the median beam for each frequency. The color map indicates linear polarized intensity. Contours correspond to total intensity and start at five times the noise level, increasing by factors of two. The direction of the EVPA is indicated by the tilted lines.
Current usage metrics show cumulative count of Article Views (full-text article views including HTML views, PDF and ePub downloads, according to the available data) and Abstracts Views on Vision4Press platform.
Data correspond to usage on the plateform after 2015. The current usage metrics is available 48-96 hours after online publication and is updated daily on week days.
Initial download of the metrics may take a while.